An Embedding-Based Approach to Trade and Economic Policy Uncertainty
In April 2025 the United States put tariffs on nearly every trading partner. One of the ways to measure that stress is the Trade Policy Uncertainty index, built by Federal Reserve economists. That month it hit the highest value in its 65-year history. 11.5% of all newspaper articles were about trade policy uncertainty.
The index counts words. An article counts if it contains a trade-policy word and an uncertainty word. It reads seven major newspapers, back to 1960.
This post reconstructs that index from the NOSIBLE World event database using only embeddings. We score 14.9 million news events against five sentences, with no keyword lists and no language model reading each article. The result matches the published benchmark at 0.87 on monthly levels and 0.82 on monthly changes, against the 0.96 and 0.70 that the two official versions reach with each other. The same method, extended to sixty sentences, rebuilds the broader Economic Policy Uncertainty index, matching the published US series at 0.77 on monthly levels.
The benchmark
Caldara, Iacoviello, Molligo, Prestipino and Raffo (2020), in the Journal of Monetary Economics, built the index. Its history lines up with the record, including the Nixon shock of 1971, the NAFTA talks, and the 2018-19 US-China trade war. A second team checked it. Baker, Bloom and Davis (BBD) built a rival trade-policy uncertainty index from different newspapers with different word lists.
Over our window the two indices agree at 0.96 on monthly levels and 0.70 on month-to-month changes. Both read mostly the same English-language newspapers with hand-tuned keyword lists. Our question is whether an embedding-based approach over the NOSIBLE event database can produce a similar signal.
Everything in this post is measured on the window where all three indices exist, 2015 to 2026, on the same dates for every pair.
The method
Every event in NOSIBLE World carries an embedding, a list of numbers describing what the event means, computed once when the event is created. It is an OpenAI text-embedding-3-large vector, stored in the event's oai_vector field. The model returns 3,072 dimensions. We keep the first 1,024 for speed, which the model's Matryoshka training makes safe, and L2-normalize them so cosine similarities stay meaningful. One real-world event is one record, no matter how many outlets cover it, and each record stores how many separate publishers did. We call that breadth, the total_netlocs field.
The whole index is five sentences, compared against each event's embedding. Three sentences define the topic. An event is about trade policy if its embedding is close to any of them.
tariffs:     "Import tariffs and duties: a government imposing, raising, threatening
              or suspending tariffs, customs duties, import quotas, surcharges or fees
              on goods imported from other countries"
agreements:  "Trade negotiations, trade agreements and trade treaties between countries:
              free trade deals being negotiated, renegotiated, signed, ratified,
              suspended or abandoned, and trade talks between governments"
disputes:    "Trade disputes, trade wars and protectionism: retaliatory tariffs,
              anti-dumping measures, import barriers, export controls and restrictions,
              boycotts of foreign goods, and trade complaints before the WTO"
Two more sentences define the uncertainty axis. They replace the paper's "AND uncertainty words" rule. Each event is scored against both, and the gap between the two scores becomes a weight.
uncertain:   "Trade policy uncertainty: the outlook for tariffs, trade agreements and
              trade rules is uncertain, unclear and unpredictable; threatened tariffs
              may or may not happen, trade negotiations are stalled or at risk of
              collapse, and businesses cannot plan for what trade policy comes next"
certain:     "Trade policy certainty and stability: a trade agreement is concluded and
              ratified, a trade dispute is resolved, tariffs are removed or finalized,
              and governments give businesses a clear, settled and predictable trade
              policy outlook"
Each day, the index is the share of publisher attention spent on trade-policy events, tilted toward the ones framed as uncertain.
relevant(e) = max cosine(event e, the 3 topic phrases) >= 0.35
polarity(e) = tanh((uncertain_sim - certain_sim) / 0.1)      # -1 resolved .. +1 uncertain
w_unc(e)    = (1 + polarity(e)) / 2                          # 0 .. 1

                  sum of breadth(e) * w_unc(e) over relevant events on day t
NOSIBLE-TPU(t) = -------------------------------------------------------------
                       trailing 12-month average of total daily breadth
The denominator strips out the growth of the corpus itself, the same way our geopolitical risk study did. The 0.35 cutoff is not load-bearing. Moving it from 0.30 to 0.40 changes every correlation by about 0.02.
That is the whole method. Scoring all 14.9 million events from 2015 to 2026 takes about twelve minutes on a laptop. The sentences work in every language the database holds, because the embeddings do. The trade index is scored over every event worldwide, not a US subset. The economic-policy index later in this post is the one exception, restricted to US events to match the published series.
It matches the benchmark
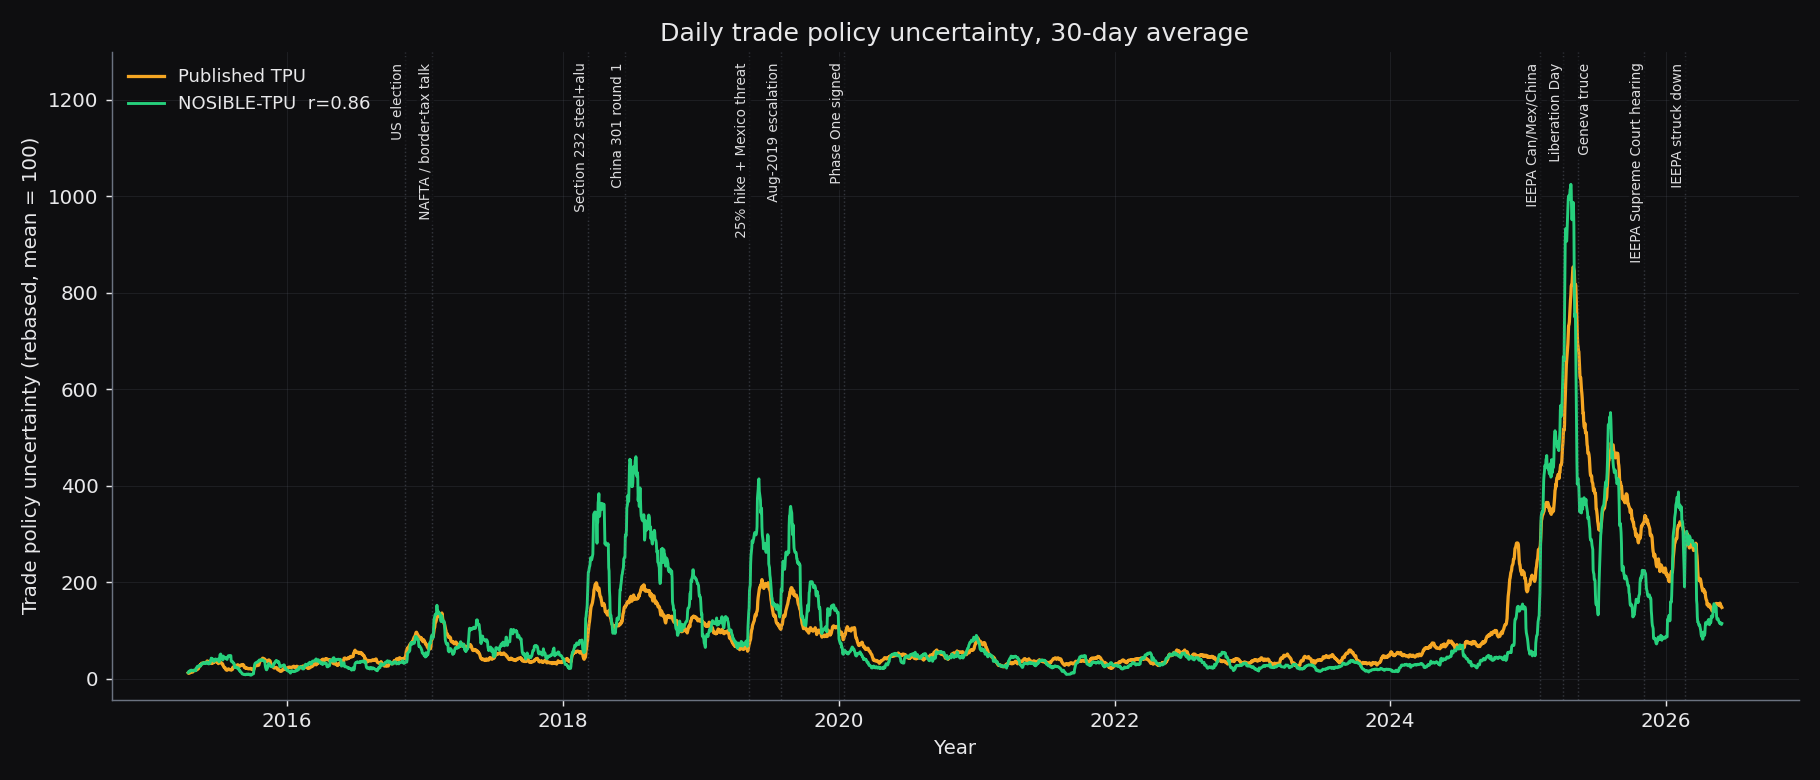
Start with the daily series. The published index dates each article by its print day. Ours dates each event by the day its coverage peaked.
Daily NOSIBLE-TPU against the published daily Trade Policy Uncertainty index, both as 30-day moving averages rebased to a common mean, 2015 to 2026. The two lines move together and correlate at 0.86 over the full window. Both stay flat to 2017, rise on the 2018 steel and China tariffs and the 2019 escalations, go quiet through 2024, then spike to record highs in 2025, with Liberation Day the tallest point. The shapes match almost exactly. The main difference is that NOSIBLE runs higher through the 2018-19 trade war.
The two daily lines correlate at 0.86 across the full window. Both sit flat through 2015 to 2017, then climb together on the 2018 steel and aluminium tariffs and the first China rounds. They peak again on the 2019 escalations, fall quiet through 2020 to 2024, and explode in 2025. Liberation Day in April 2025 is the single tallest spike in eleven years, followed by the Geneva truce and the 2026 Supreme Court ruling on the emergency-powers tariffs. The shapes match closely; only the height differs. NOSIBLE runs higher through the 2018-19 trade war, because that war was a larger share of a global, then-smaller corpus than of seven US and UK papers.
Now the monthly view, with the second published measure added.
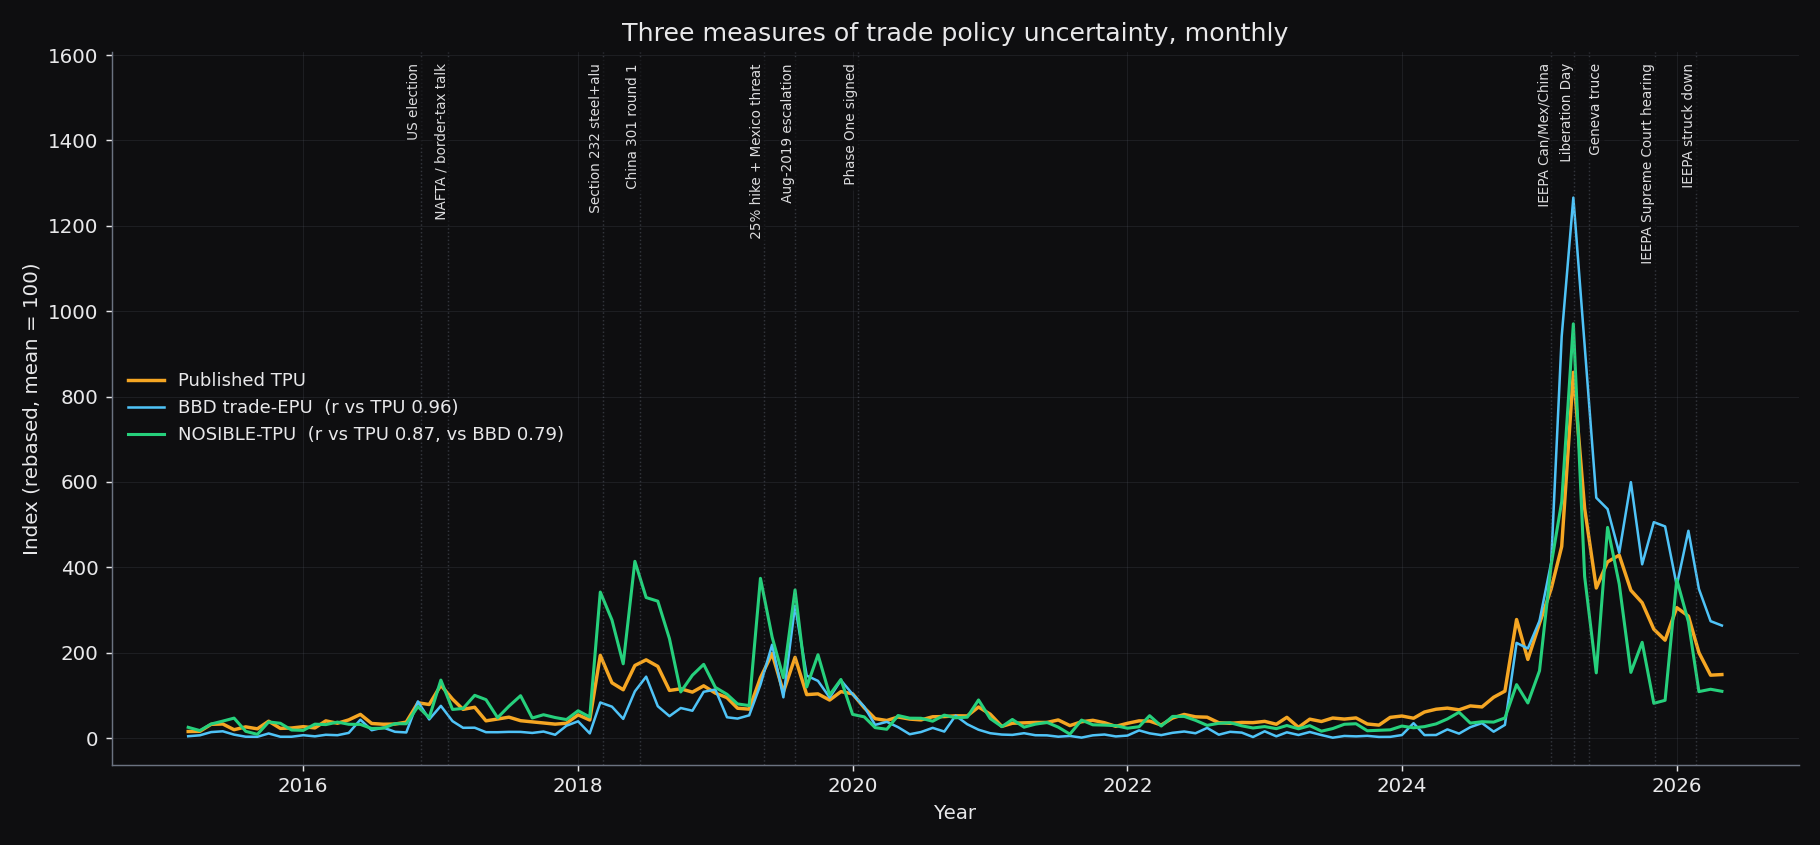 Three monthly measures of trade policy uncertainty, rebased to a common mean and aligned on the same dates, the published TPU, the Baker-Bloom-Davis trade-policy EPU, and NOSIBLE-TPU. All three track each other and peak together in April 2025. Against the published TPU the two official measures agree at 0.96 on levels and 0.70 on changes, while NOSIBLE matches it at 0.87 and 0.82, so on month-to-month changes it tracks the benchmark more closely than the two official measures track each other.
The published TPU, the BBD trade-policy EPU, and NOSIBLE-TPU move together across the whole window. Against the published TPU, BBD scores 0.96 on levels and 0.70 on changes. NOSIBLE scores 0.87 and 0.82. On the month-to-month changes, our index agrees with the benchmark more closely than the two published measures agree with each other. All three rank April 2025 as their highest month.
Every pair, on the same dates:
| pair | monthly level / change | quarterly level / change |
|---|---|---|
| TPU ~ BBD (the bar) | 0.96 / 0.70 | 0.98 / 0.93 |
| TPU ~ NOSIBLE | 0.87 / 0.82 | 0.90 / 0.83 |
| BBD ~ NOSIBLE | 0.79 / 0.52 | 0.85 / 0.71 |
NOSIBLE is closer to TPU than to BBD on every change metric.
It spikes in the same months
A correlation can hide a lot, so we check the months one by one. All three indices rank April 2025 as their top month. Every one of the twelve episodes we flag lands above the 60th percentile in all three, and every pair of indices peaks together with no lag. Here is a selection, ranked out of 135 months.
| episode | month | TPU rank | BBD rank | NOSIBLE rank |
|---|---|---|---|---|
| Section 232 steel and aluminium | 2018-03 | 18 | 34 | 11 |
| China Section 301, round one | 2018-06 | 22 | 28 | 4 |
| August 2019 escalation | 2019-08 | 19 | 15 | 10 |
| Phase One deal signed | 2020-01 | 38 | 30 | 53 |
| IEEPA tariffs on Canada, Mexico, China | 2025-02 | 7 | 11 | 5 |
| Liberation Day | 2025-04 | 1 | 1 | 1 |
| Geneva truce | 2025-05 | 2 | 3 | 6 |
| IEEPA Supreme Court hearing | 2025-11 | 14 | 7 | 44 |
| IEEPA struck down | 2026-02 | 11 | 9 | 15 |
Two rows stand out. NOSIBLE ranks the 2018-19 trade war higher, because the trade war was a bigger share of a global corpus than of seven US and UK papers. And it ranks the late-2025 litigation months lower, when trade-relevant coverage was lighter.
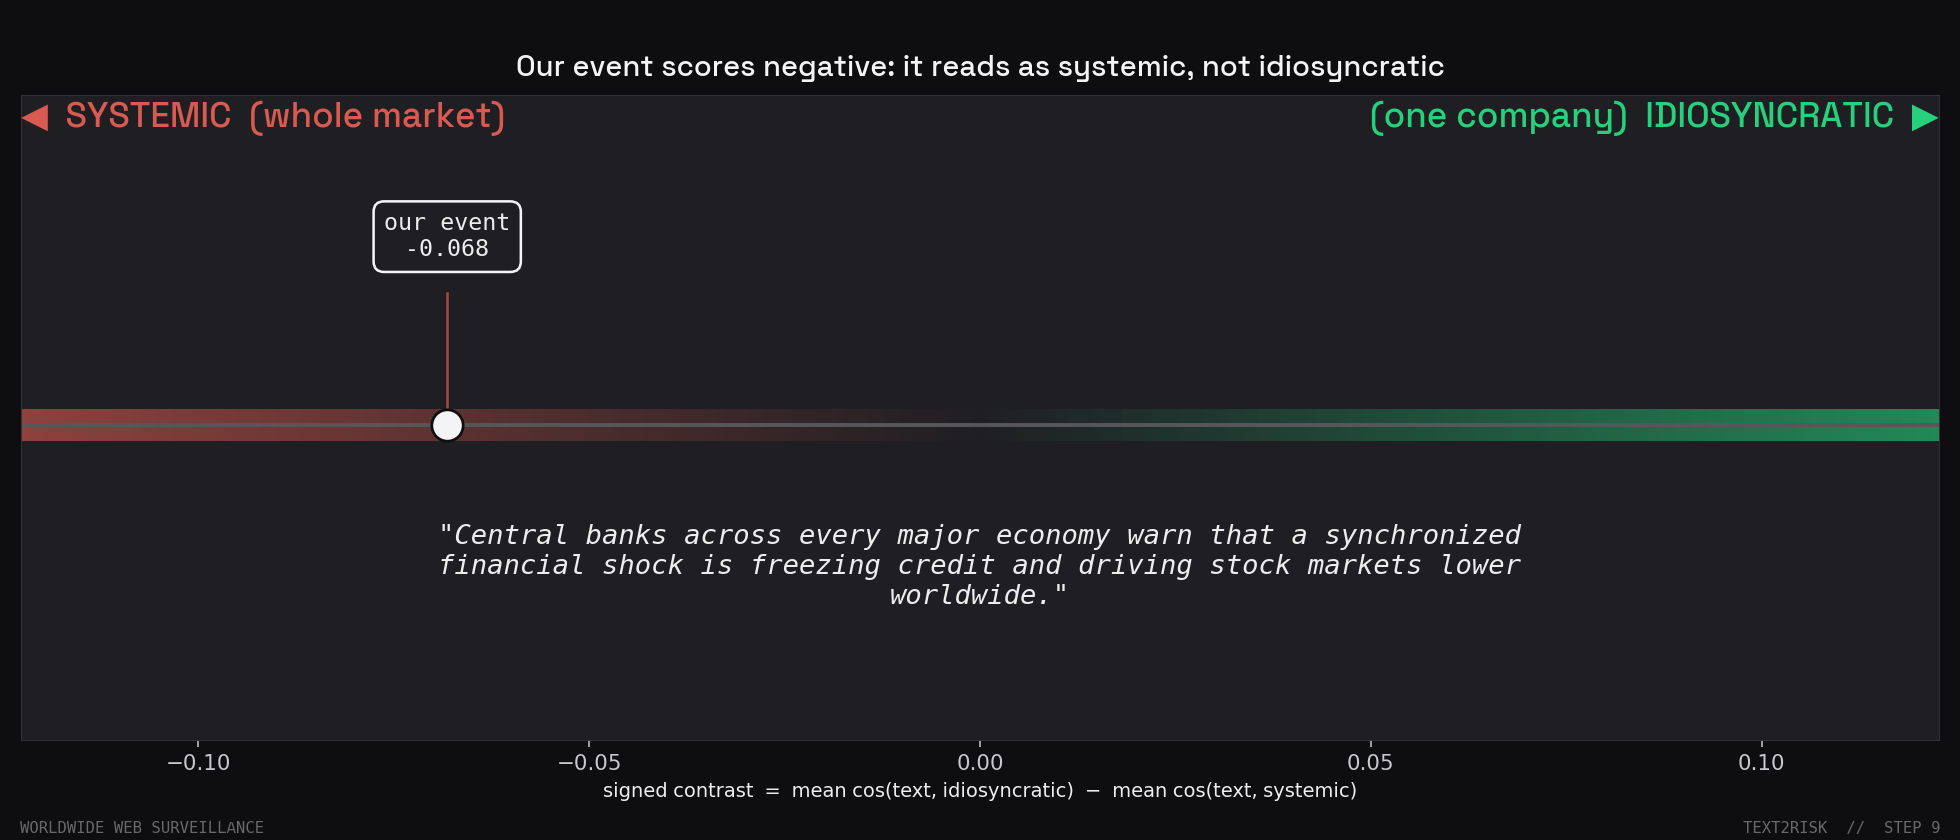
A signed uncertainty axis
The paper's key rule is the AND. Trade words alone do not count, an uncertainty word has to appear too. Our version of that rule is the per-event weight, built from the two opposing sentences. Unlike the original, it has a sign.
The weight reflects the events, not the sentences. On the 0-to-1 weight, where 0.5 is neutral, events clearly not about trade average 0.44, just below neutral, while events that pass the trade filter average 0.63, tilted toward uncertainty. It also discriminates rather than pushing everything toward the middle. Among the events the index counts, 60% land clearly on the uncertain side of the weight, above 0.6, and 21% clearly on the settled side, below 0.4. The remaining fifth sit in the neutral band between, where the uncertain and certain sentences score about evenly.
The chart below shows the net polarity of each day's trade coverage. Every relevant event gets a polarity score, from -1 fully resolved to +1 fully uncertain, and the daily reading is the breadth-weighted average over that day's events.
                  sum of breadth(e) * polarity(e) over relevant events on day t
net_polarity(t) = ---------------------------------------------------------------
                       sum of breadth(e) over relevant events on day t
The raw line is noisy, so we add a state-dependent smoother on top. When polarity jumps sharply toward uncertainty, 1.5 standard deviations above its trailing year with no look-ahead, the smoother switches to a fast 3-day half-life and picks up the shock at once. On calm days, and on moves toward resolution, it runs a slow 30-day half-life. The asymmetry is there to capture the spikes quickly.
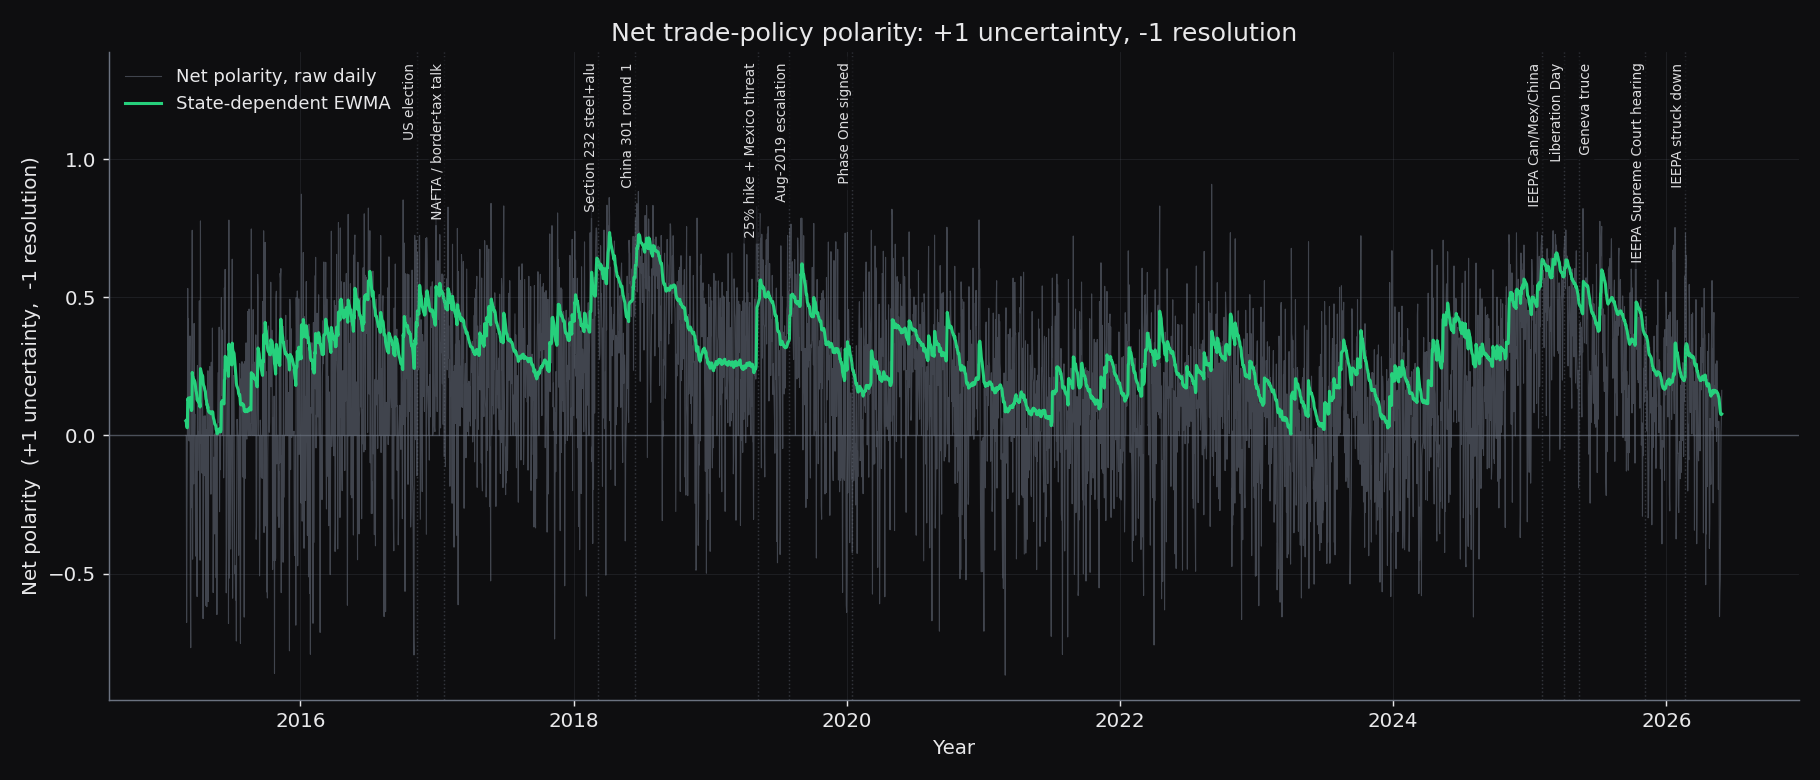 The daily net polarity of trade-policy coverage, scored from -1 when coverage is resolution-framed to +1 when it is uncertainty-framed, with a state-dependent smoothing overlay. The line runs positive during escalations, +0.59 at the 2018 China tariffs and +0.48 on Liberation Day, sits near zero through the quiet stretch of 2021, and turns negative when a dispute resolves, such as the January 2020 Phase One deal. This signed direction is what the published level-only index cannot show, telling a resolved story apart from a simply quiet news week.
The polarity reads +0.59 during the China 301 escalation and +0.48 on Liberation Day. It sits near zero through the quiet stretch of 2021. It turns negative toward resolution when the Phase One deal is signed in January 2020. The published index also drops that month, but a keyword count drops the same way in any quiet month when trade simply leaves the news. A level on its own cannot tell a resolved dispute from a slow news week, but the sign can. A fall toward resolution means a story closed; a reading near zero means it went quiet.
When uncertainty runs high, tariffs tend to follow
A fair question about any news-based index is whether it tracks something that turns into policy, or only how loudly the press is talking. The chart plots the realized US tariff rate, customs duties divided by imports of goods from the quarterly BEA NIPA tables (via DBnomics), against all three news indices on the same quarters.
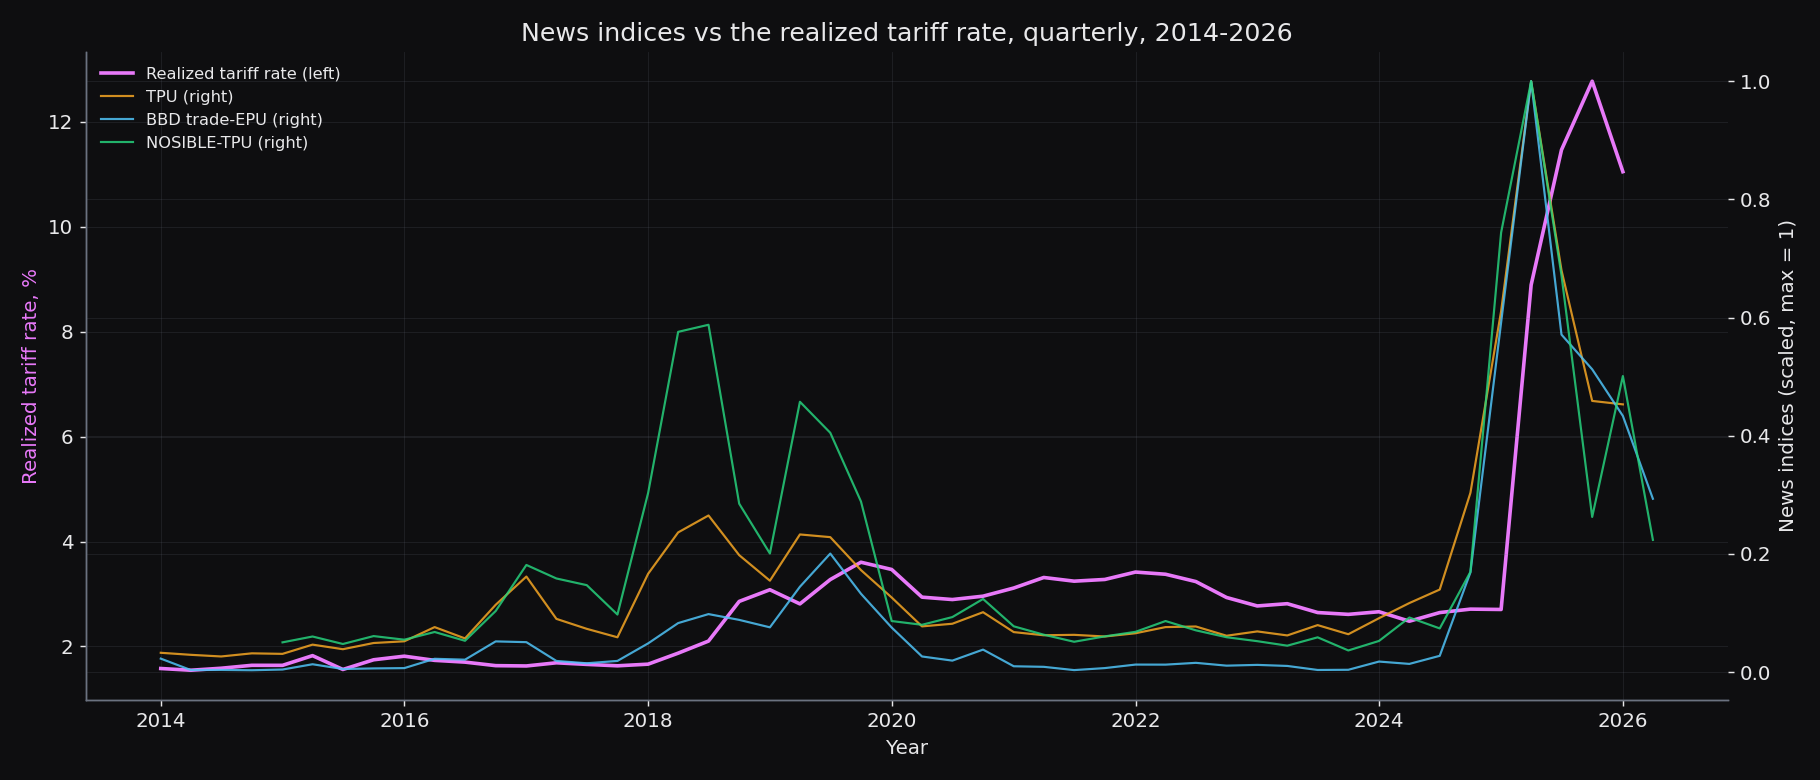 The realized US tariff rate, quarterly, plotted against all three trade-policy-uncertainty indices, 2014 to 2026. The tariff rate edges up through the 2018-19 trade war, from 1.4% to 3%, then explodes from 2.6% to 12.8% in 2025, the largest move since the 1970s. The news indices lead the realized rate. Each index's level lines up with the next quarter's change in the tariff rate at 0.61 for TPU, 0.59 for BBD and 0.66 for NOSIBLE. Higher uncertainty tends to be followed by higher tariffs.
The higher the uncertainty, the more likely tariffs actually arrive, and the larger the move when they do. Through the 2018-19 threat war the indices rose and the realized rate crept up with them, from 1.4% to 3%. In 2025, when uncertainty reached its highest level on record, the rate exploded from 2.6% to 12.8%, the largest move since the Nixon era. The news indices lead the realized rate. Each index's level lines up with the following quarter's change in the tariff rate at 0.61 for TPU, 0.59 for BBD and 0.66 for NOSIBLE. Elevated trade policy uncertainty does not guarantee tariffs, but the higher it runs, the more often they follow.
Where it misses
Two things did not line up.
The 2018-19 size. After rebasing, NOSIBLE's trade-war months run about twice as high as the published index. The timing matches; the magnitude reflects whose attention you are counting, a global corpus rather than seven US and UK papers.
Late-2025 litigation. While the legal challenge to the 2025 emergency-powers tariffs worked through the courts, NOSIBLE eased back toward normal while the published indices stayed elevated. The litigation drew far less trade-relevant coverage than the active tariff actions earlier in the year, so NOSIBLE's trade signal was only modestly above normal in those months. The November 2025 oral arguments are the clearest case, TPU rank 14 against NOSIBLE rank 44; the February 2026 ruling brought NOSIBLE back in line, rank 15 against TPU's 11.
The harder test: all of economic policy
Trade is one topic. The real question is whether the recipe holds on something that covers all of economic policy at once. So we ran it against Baker, Bloom and Davis's Economic Policy Uncertainty index (Quarterly Journal of Economics, 2016). Their method counts articles that contain an economy word, a policy word and an uncertainty word across ten leading US newspapers. From that one index they also build category indices. We rebuild two, national security and healthcare.
The yardstick comes the same way it did for trade. The paper's own two US versions, the 10-paper monthly index and the roughly 1,500-paper Newsbank daily index aggregated to monthly, are two measurements of one thing from different corpora. Over our window they agree at 0.92 on levels and 0.65 on changes.
Scaling from one topic to all of economic policy needed two changes to the trade recipe.
First, name the decisions. A single "economic policy uncertainty" sentence fails. The defining US events of April 2020, the Fed cutting rates to zero and the first shutdown orders, embed as concrete acts, not as the abstract idea of economic policy, so they score below any usable cutoff. The fix is a list of decision types, each written as a few concrete sentences. We use ten levers: monetary policy, taxes, spending, debt and shutdowns, entitlements, regulation, financial regulation, trade, major economic laws, and shutting down or reopening the economy. An event counts if its embedding is close to any of them.
Second, pair the uncertainty sentences topic by topic. For trade, one uncertain-versus-certain pair was enough, because both sentences were full of trade words. Across many topics a single generic pair is lopsided. Uncertainty shares a vocabulary across topics ("may", "unclear", "stalled"), but resolution is always written as the topic's own concrete act ("signs the bill", "imposes the tariffs", "cuts rates"). Articles rarely say "policy is now certain". So every lever is a matched pair. One sentence frames the decision as proposed, threatened or undecided. The other frames the same decision as done and in force. Each event reads its polarity off its best-matching pair. The full set is sixty sentences, listed in the appendix. One pair shows the shape.
tariffs, uncertain:  "The government is threatening or proposing to impose, raise,
                      suspend or lift tariffs, but it is unclear what it will actually do."
tariffs, certain:    "The government has imposed, raised, suspended or lifted tariffs,
                      and the tariff decision has taken effect."
The rest is the trade recipe unchanged, with one change to the denominator to match the paper's own normalization.
relevant(e) = max cosine(event e, all lever sentences) >= 0.35
polarity(e) = tanh((uncertain_sim - certain_sim) / 0.1)   # within the best-matching pair
w_unc(e)    = (1 + polarity(e)) / 2

                  sum of breadth(e) * w_unc(e) over relevant US events in month t
NOSIBLE-EPU(t) = -------------------------------------------------------------------
                  trailing 12-month average of total US-attributed monthly breadth
This index is US-only on both lines. An event is US-attributed if its tagged primary country is the United States. The numerator is US events that are economic-policy-relevant, and the denominator is all US events. We scale US attention by US attention, the way the published index scales US articles by US articles. The category indices add one rule. A national-security or healthcare event must also sit close enough (0.25) to that category's own sentence pairs, matching the paper's category definition.
One lever earns a note. A keyword count caught COVID for free, because every closure article had an economy word, a policy word and an uncertainty word somewhere in its text. An event embeds as its core meaning, with no such incidental words, so the nine levers taken from the paper's pre-2020 categories could not see "government orders businesses to close". The tenth lever covers shutting down or reopening the economy. We wrote it in timeless terms, with nothing about any one pandemic, and we keep it as a separate line on the chart so the choice is visible.
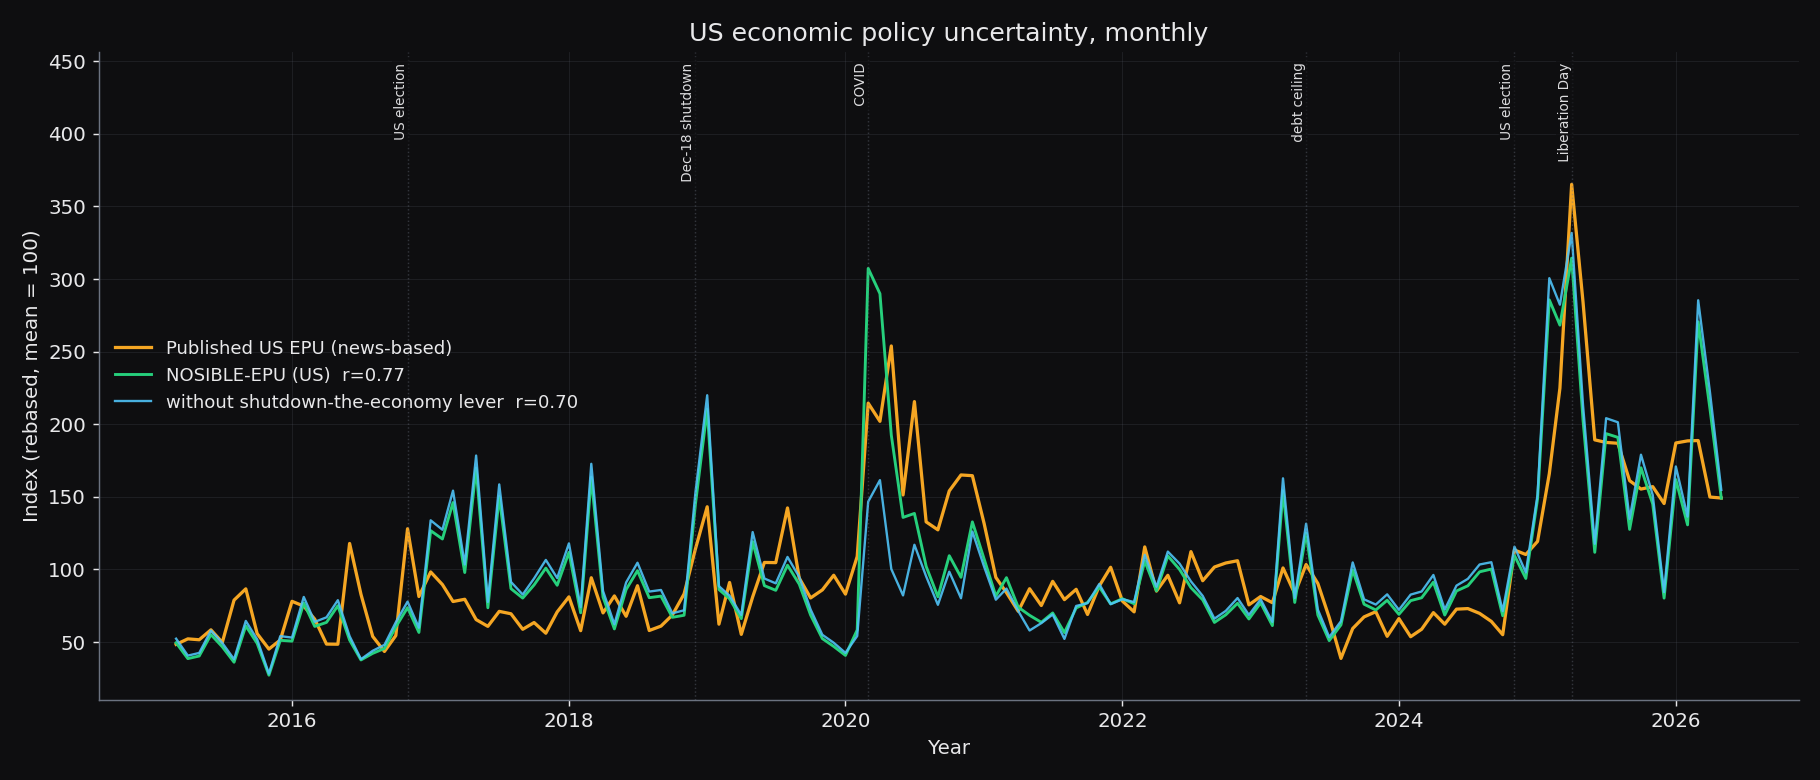 NOSIBLE-EPU against the published US Economic Policy Uncertainty index, monthly and rebased, with a nine-lever version that drops the shutdown lever shown as a diagnostic line. NOSIBLE tracks the published index at 0.77 on levels and 0.53 on changes. Both rank April 2025 the highest month of the period, and both place the COVID shock of spring 2020 near the top. The two NOSIBLE lines agree everywhere except 2020, which shows that the entire COVID gap comes down to the single shutdown lever.
NOSIBLE-EPU tracks the published US index at 0.77 on levels and 0.53 on changes. The two indices agree on where the big spikes are. Both rank April 2025 as the highest month of the eleven years, and both put the COVID shock of March and April 2020 and the 2025 tariff run in their top few. The cyan line drops the shutdown lever. The two NOSIBLE lines agree everywhere except 2020, where the gap is large and positive in March, April and May, then fades to nothing by mid-2021 and shows no real divergence anywhere else in eleven years. The whole COVID gap comes down to that one lever. Where NOSIBLE runs hotter than the keyword count is on clear-cut decisions like the February 2025 tariffs. Where it runs cooler is the back half of 2025, the condition-driven stretch discussed below.
| target | monthly level / change |
|---|---|
| The bar (the paper's own two US variants) | 0.92 / 0.65 |
| US vs published US EPU | 0.77 / 0.53 |
| National security vs published categorical | 0.83 / 0.59 |
| Healthcare vs published categorical | 0.73 / 0.44 |
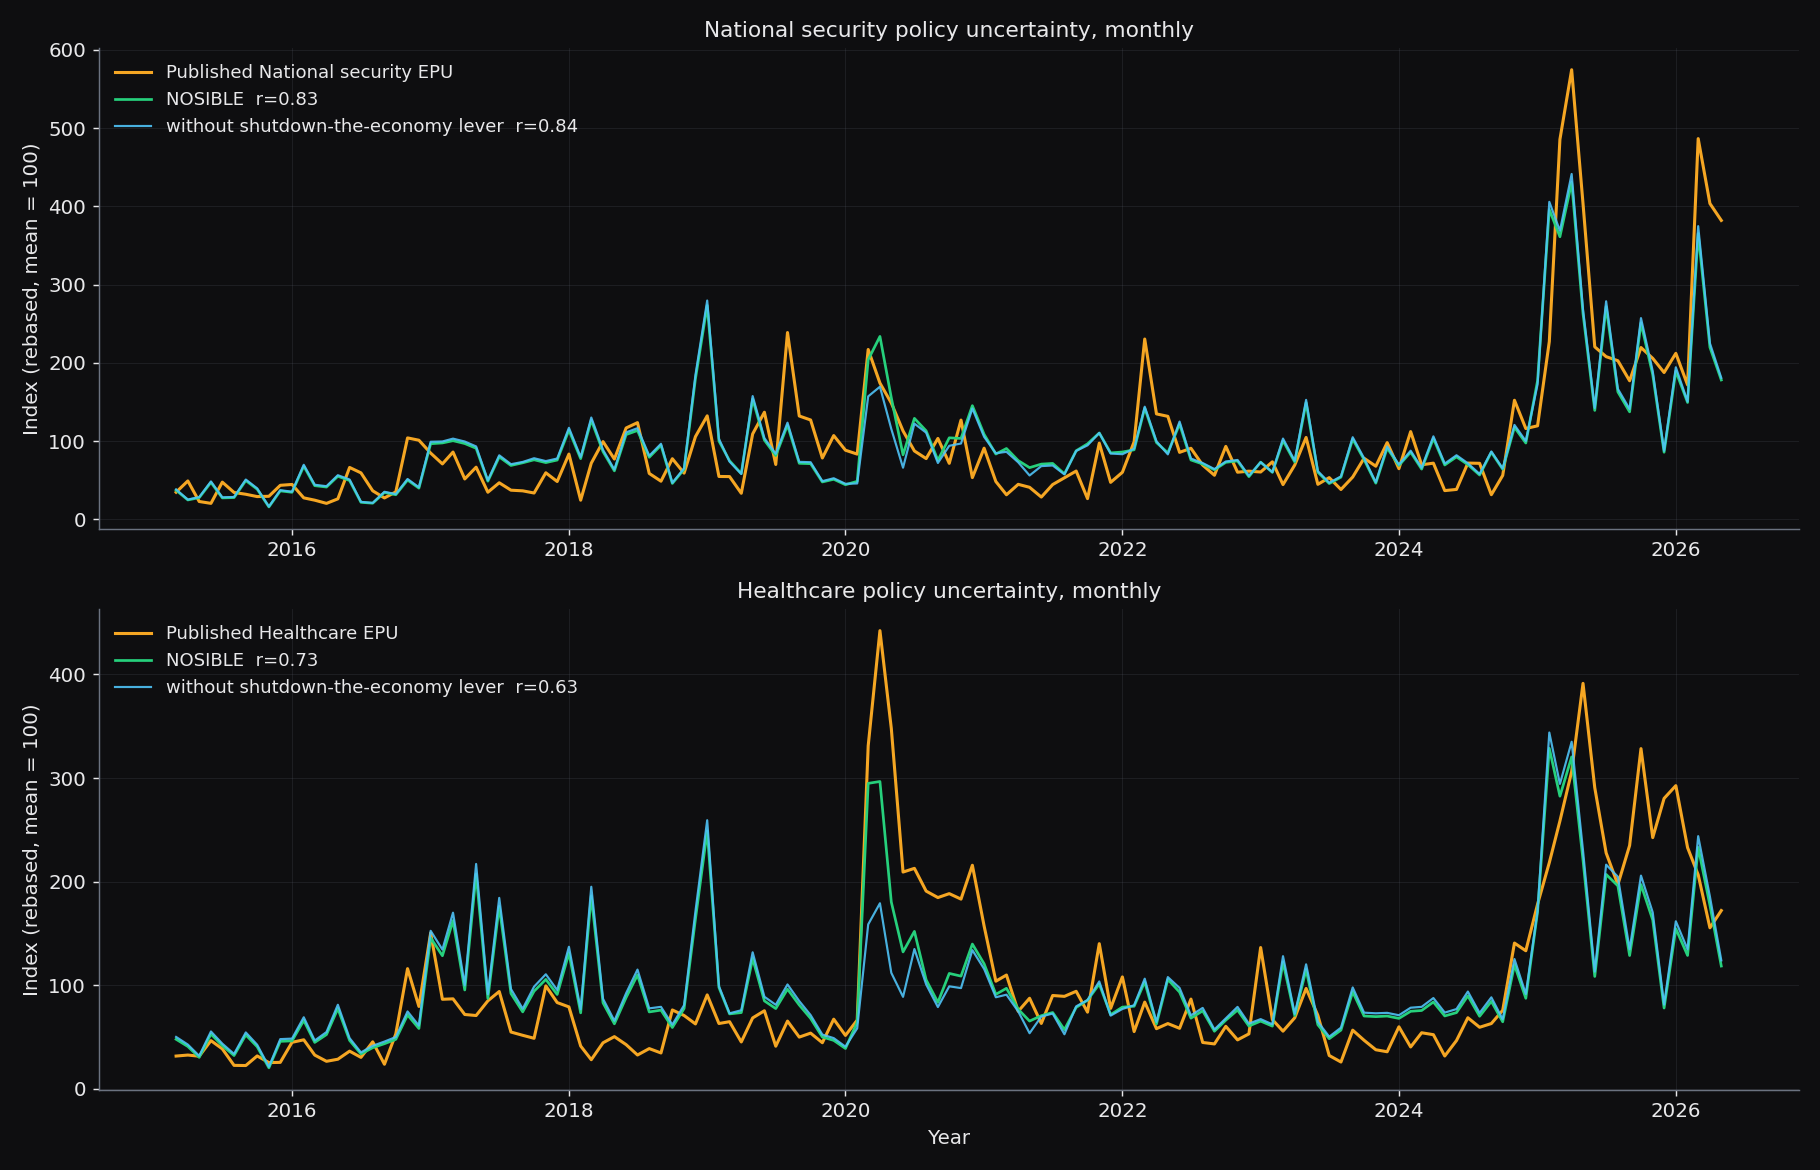 The national-security and healthcare categories of Economic Policy Uncertainty, NOSIBLE against the published categorical series, monthly. National security tracks the published series at 0.83 on levels and 0.59 on changes, with both ranking April 2025 first. Healthcare is looser at 0.73 and 0.44 but agrees on the periods that dominate the series, the COVID spring of 2020 and the 2025 health-policy upheaval. Both categories come from the same sentence set as the headline index, with no extra word lists.
The two category indices spike in the right places. National security tracks the published series closely through the 2025-26 cluster, with both ranking April 2025 first, carrying heavy sanctions-and-retaliation coverage, and March 2025 and March 2026 close behind in both. It scores 0.83 on levels and 0.59 on changes. Healthcare scores 0.73 and 0.44, and agrees on the two periods that dominate the series, the COVID spring of 2020 and the 2025 health-policy upheaval, the Medicaid changes in the tax bill, the ACA-subsidy fight, and the leadership turnover at HHS. It also picks up the May 2017 attempt to repeal the Affordable Care Act, a clear legislative fight the keyword count ranks far down. Healthcare is the loosest of the four indices.
The replication is real, but looser than trade, and the gap has one cause. It is the difference between counting words and measuring events. The published EPU counts coverage of conditions whenever it mentions policy. A record-unemployment article counts as long as it has an economy word, a government word and an uncertainty word somewhere in the text. Our index counts only events that embed as policy decisions. So months driven by conditions, like spring 2020's jobless-claims records or late 2025's background tariff mentions, sit below the published series. The category gaps come from the same difference. The published healthcare series counts the daily run of premium, Medicaid and insurance-cost coverage whenever it carries the right words, while NOSIBLE counts only health-policy decisions, so that ambient coverage does not lift our series the way it lifts theirs.
Against those misses, the method scales in a way the keyword approach cannot. One sentence set and one cutoff build the headline index and both categories at once, while the paper hand-builds a separate word list for each category. The same index runs for any country as a group-by on the country field, in every language, while the paper needs local newspapers and a translated word list for each one. Adding a category or a country is nearly free.
One recipe, two index families
The two replications are the same recipe at two sizes. The Trade Policy Uncertainty index came from five sentences. The Economic Policy Uncertainty family, the headline index plus its national-security and healthcare categories, came from sixty. Neither used a keyword list or a language model reading each article. Both used only the embeddings the database already stores, compared against a handful of sentences.
Both clear the bar we set, which is how closely the existing published indices match each other. NOSIBLE-TPU matches the published trade index as closely as the two published trade indices match each other, and more closely on the changes. NOSIBLE-EPU and its categories reach 80 to 90 percent of the agreement the published versions have among themselves, from one sentence set where the paper needs a word list per category. Both spike in the right months. Both carry a signed uncertainty-versus-resolution axis, a direction the published indices do not provide. And both run in every language at once.
Nothing here is specific to trade or economic policy. The same recipe points at monetary-policy uncertainty, sanctions risk, energy-transition policy, or anything else people have measured with a keyword list. Writing the sentences takes an afternoon. The validation is the real work, and it now exists as a template.
Future work
The index is defined by two ingredients, the set of anchor sentences and the function that scores events against them. Both are deliberate but unoptimized, and each marks a direction for future work.
The first is the anchor set. The trade-policy and economic-policy constructs were written by hand and calibrated against a single benchmark, so they are unlikely to be optimal. More precise definitions, and a broader set covering sub-topics the current phrases miss, should improve fidelity to the published series and narrow the documented gaps, in particular the shortfall on condition-driven rather than decision-driven coverage. Whether such anchors are best authored by hand, mined from the corpus, or learned against the benchmark is itself an open question.
The second is the scoring function, which matters most for the signed certainty-versus-uncertainty axis. That axis maps the gap between two similarity scores through a fixed monotone transform, a modeling choice rather than a result, and a calibrated or learned mapping is the natural next step. Each of these directions can be evaluated the same way, against the published benchmarks.
Work with us
NOSIBLE turns the world's news into a structured, multilingual, de-duplicated event database, and this post used one slice of it. If you want access to that database, or a signal like these built for your own models, start a trial. You can explore the live data at nosible.world.
References
- Caldara, Dario, Matteo Iacoviello, Patrick Molligo, Andrea Prestipino and Andrea Raffo (2020). The Economic Effects of Trade Policy Uncertainty. Journal of Monetary Economics 109, 38-59. Index and data: matteoiacoviello.com/tpu.
- Baker, Scott R., Nicholas Bloom and Steven J. Davis (2016). Measuring Economic Policy Uncertainty. Quarterly Journal of Economics 131(4), 1593-1636. The headline US EPU, the daily US EPU, the categorical national-security and healthcare series, and the categorical trade-policy series used in the trade sections are all from policyuncertainty.com.
- Caldara, Dario and Matteo Iacoviello (2022). Measuring Geopolitical Risk. American Economic Review 112(4). The sibling index, rebuilt from NOSIBLE World in our previous post.
- Customs duties and imports of goods: BEA NIPA tables via DBnomics.
Appendix: the full EPU anchor set
Everything you need to repeat the EPU results is here. Embed the sentences below with the same model used for the event embeddings (we use OpenAI text-embedding-3-large, truncated to its first 1,024 dimensions and re-normalized, which matches the vectors stored on every NOSIBLE World event). Score each event as the cosine against each sentence, then apply the formulas above. A lever's score is the highest of its two framings. Relevance is the highest score over all levers. Each event's polarity comes from the pair whose better framing scores highest. U is the uncertain sentence, C the certain one.
MONETARY
U: It is uncertain whether the central bank will raise, cut or hold interest rates,
   and markets do not know which way the decision will go.
C: The central bank has announced its decision to raise, cut or hold interest rates,
   and markets know exactly where rates stand.
U: The central bank may change its quantitative easing, balance-sheet or money-supply
   policy, but its plans remain unclear.
C: The central bank has finalized its quantitative easing, balance-sheet and
   money-supply policy, and its plans are clear.
U: A dispute over the central bank's independence or leadership has made the future
   of monetary policy unpredictable.
C: The central bank's independence and leadership are secure, and the future of
   monetary policy is predictable.

TAXES
U: The government may cut taxes, raise taxes or change tax credits, and proposals are
   on the table, but nothing has been decided or enacted.
C: The government has enacted its plan to cut taxes, raise taxes or change tax
   credits, and the new tax rules are law.
U: A major overhaul of the tax code has been proposed and is being debated, and it is
   uncertain whether the tax reform will pass.
C: A major overhaul of the tax code has been signed into law, and the tax reform is
   settled.

SPENDING
U: Proposals to raise, cut or freeze public spending and funding are on the table,
   but it is uncertain what the government will decide.
C: The government has finalized its decision to raise, cut or freeze public spending
   and funding.
U: The federal budget, appropriations or economic stimulus package has been proposed
   but is stuck in negotiations and may not pass.
C: The federal budget, appropriations or economic stimulus package has been passed
   and signed into law.

DEBT
U: A debt-ceiling standoff or looming government shutdown has left government funding
   in doubt.
C: A debt-ceiling deal has been reached and the government shutdown has been averted
   or ended, securing government funding.
U: There is growing concern that the budget deficit, the national debt or the
   currency could spiral into a sovereign-debt crisis.
C: The budget deficit and national debt are under control, and the sovereign-debt and
   currency pressures have been resolved.

ENTITLEMENTS
U: Proposed changes, cuts or reforms to public pensions, retirement benefits and
   welfare programs may or may not go ahead.
C: Changes, cuts or reforms to public pensions, retirement benefits and welfare
   programs have been enacted and are final.

REGULATION
U: The government has proposed new rules or a rollback and is weighing whether to
   tighten regulation on business or to deregulate, and the outcome is uncertain.
C: The government has enacted its decision to tighten regulation on business or to
   deregulate and roll back rules.
U: An antitrust or competition case against companies is under way and its outcome is
   uncertain.
C: The antitrust or competition case against the companies has been decided, and the
   enforcement outcome is final.

FINANCIAL REGULATION
U: Regulators have proposed new supervision and capital rules for banks and financial
   markets, but nothing is final and the rules remain in flux.
C: Regulators have finalized the supervision and capital rules for banks and
   financial markets, and the rules are fixed.
U: A bank bailout or rescue of the financial system is being debated and may or may
   not happen.
C: The bank bailout and rescue of the financial system have been completed, and the
   financial system has been stabilized.

TRADE
U: The government is threatening or proposing to impose, raise, suspend or lift
   tariffs, but it is unclear what it will actually do.
C: The government has imposed, raised, suspended or lifted tariffs, and the tariff
   decision has taken effect.
U: A trade agreement between governments is under negotiation and may or may not be
   concluded.
C: A trade agreement between governments has been signed and concluded.
U: A trade war, trade dispute, sanctions or export controls could escalate, and
   nobody knows how far it will go.
C: The trade war and trade dispute have been settled, and the sanctions and export
   controls are fixed and final.

MAJOR ECONOMIC POLICY ACTIONS
U: A major economic law or executive order on the economy has been proposed and is
   being considered, and may or may not be enacted.
C: A major economic law or executive order on the economy has been enacted and is in
   force.
U: A major economic reform or government intervention in the economy has been
   proposed and is under discussion, and its fate is uncertain.
C: A major economic reform or government intervention in the economy has been carried
   out as planned.
U: The leadership of an economic agency may be fired, replaced or shaken up, and the
   agency's direction is unclear.
C: New leadership of the economic agency has been appointed and confirmed, and the
   agency's direction is settled.

SHUTTING DOWN THE ECONOMY
U: The government may shut down the economy and order businesses to close, and how
   long the shutdown of the economy will last is unclear.
C: The government has shut down the economy and ordered businesses to close, and the
   shutdown is now in force.
U: It is unclear when the government will reopen the economy and let businesses and
   economic activity resume.
C: The government has reopened the economy, and businesses and economic activity are
   resuming as planned.

CATEGORY: NATIONAL SECURITY
U: A war, armed conflict or military invasion could break out or escalate, and it is
   unclear how the conflict will unfold.
C: The war, armed conflict or military invasion has ended, and a ceasefire or peace
   agreement is in place.
U: There are fears of terrorism and warnings that a terrorist attack may happen.
C: The terrorist plot has been foiled and the attackers caught, and the terrorism
   threat has been contained.
U: It is uncertain whether defense spending, the military budget or weapons
   procurement will be increased or cut.
C: The defense budget has been approved, settling defense spending, the military
   budget and weapons procurement.
U: Sanctions, blockades or embargoes are being threatened or considered, and it is
   unclear whether they will be imposed.
C: The sanctions, blockades or embargoes have been imposed or lifted, and the
   decision is final.

CATEGORY: HEALTHCARE
U: The future of government health insurance and public healthcare programs is
   uncertain, with changes proposed but not decided.
C: The changes to government health insurance and public healthcare programs have
   been enacted and finalized.
U: Health insurance coverage, premiums, subsidies and healthcare costs may change,
   and people face an unpredictable outlook.
C: Health insurance coverage, premiums, subsidies and healthcare costs have been set,
   and people have a clear outlook.
U: Decisions on drug pricing, medical products and pharmaceutical or vaccine
   regulation are pending, leaving the industry uncertain.
C: Decisions on drug pricing, medical products and pharmaceutical or vaccine
   regulation have been finalized and announced.
U: The government may fire health officials, cut the funding of its health agencies
   or shake up their leadership, and the direction of health policy is unclear.
C: The government has appointed and confirmed the leadership of its health agencies
   and secured their funding, and the direction of health policy is settled.
All correlations are computed on the common window, 2015-03 to 2026-05 monthly, on jointly non-null rows after rebasing each series to its own mean. The published US EPU is the news-based Fig-1 series from policyuncertainty.com, and the categorical series are the "National security" and "Health care" columns of their categorical file. The relevance threshold of 0.35 was chosen by a sweep against the published US index and applied unchanged to both categories. The category threshold is 0.25.
Point-in-Time Knowledge Graphs over Named Entities with NOSIBLE World
Two Tricks for Turning Sentence Embeddings into Clean Features