Point-in-Time Knowledge Graphs over Named Entities with NOSIBLE World

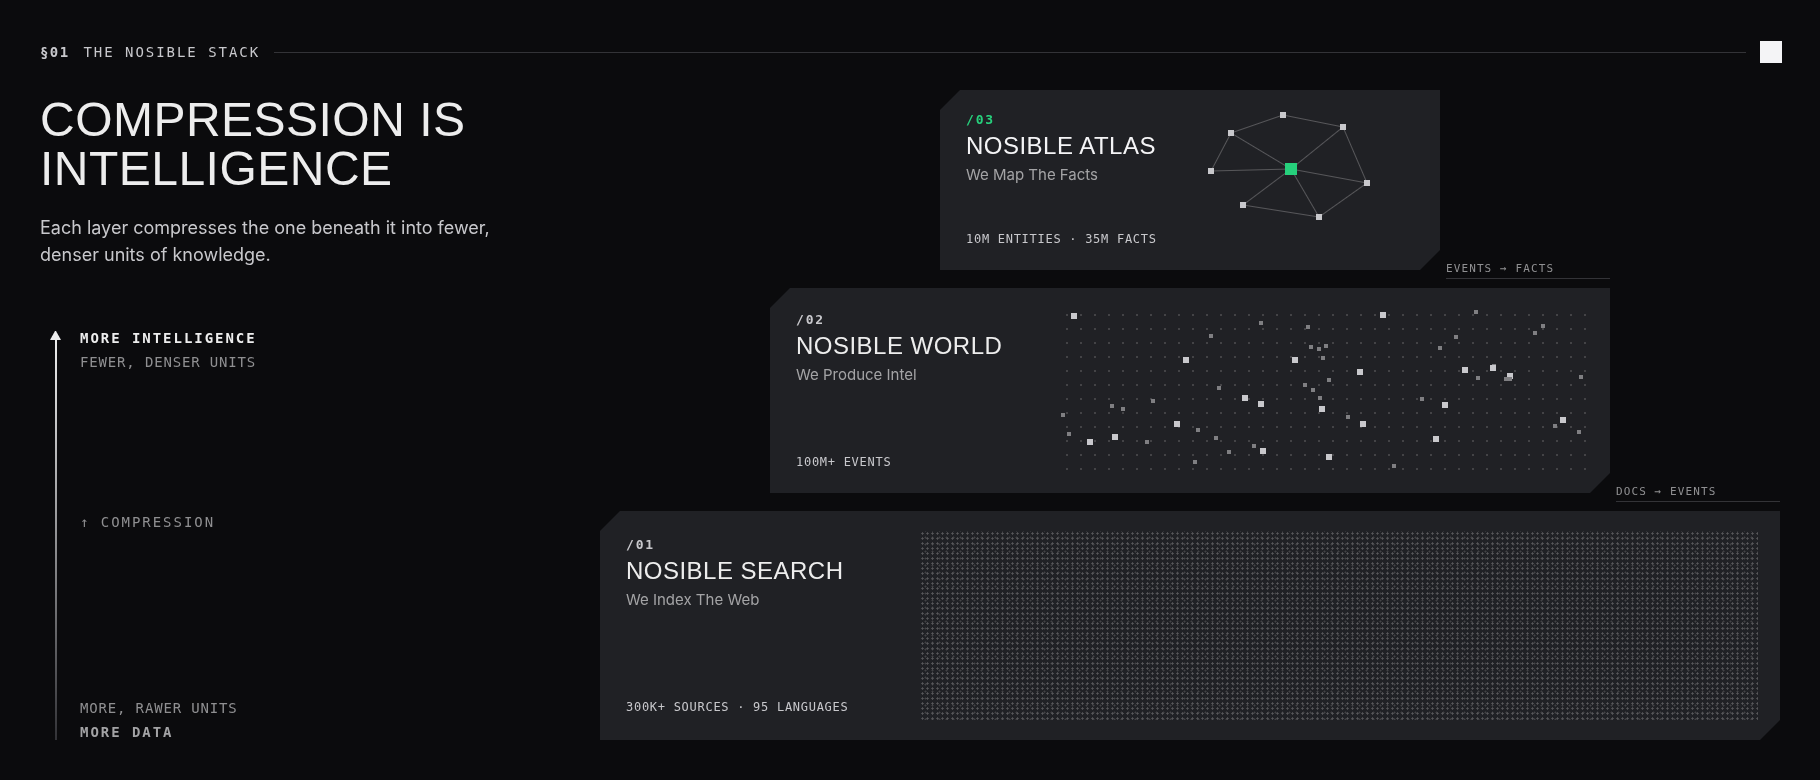
Companies change over time. People leave. Products evolve. Mergers happen. One of the topics we are interested in at NOSIBLE is capturing and structuring point-in-time knowledge. In this post we demonstrate how you can build point-in-time knowledge graphs from NOSIBLE World. For reference, World covers 38 thousand tickers, 3.2 million organizations, and 6.4 million people.
The Ideas in Brief
Named entity recognition is a computer program that automatically reads text to find and categorize important nouns like people, places, and companies. A sentence like "NVIDIA unveiled Blackwell at GTC in San Jose, and Jensen Huang demonstrated it against AMD" carries four kinds of entity: an organization (NVIDIA, AMD), a product (Blackwell), a person (Jensen Huang), and a place (San Jose). NOSIBLE World runs NER over every event and records many entity types; this post focuses on five: ORG, PERSON, GPE and LOC for places, and PRODUCT.
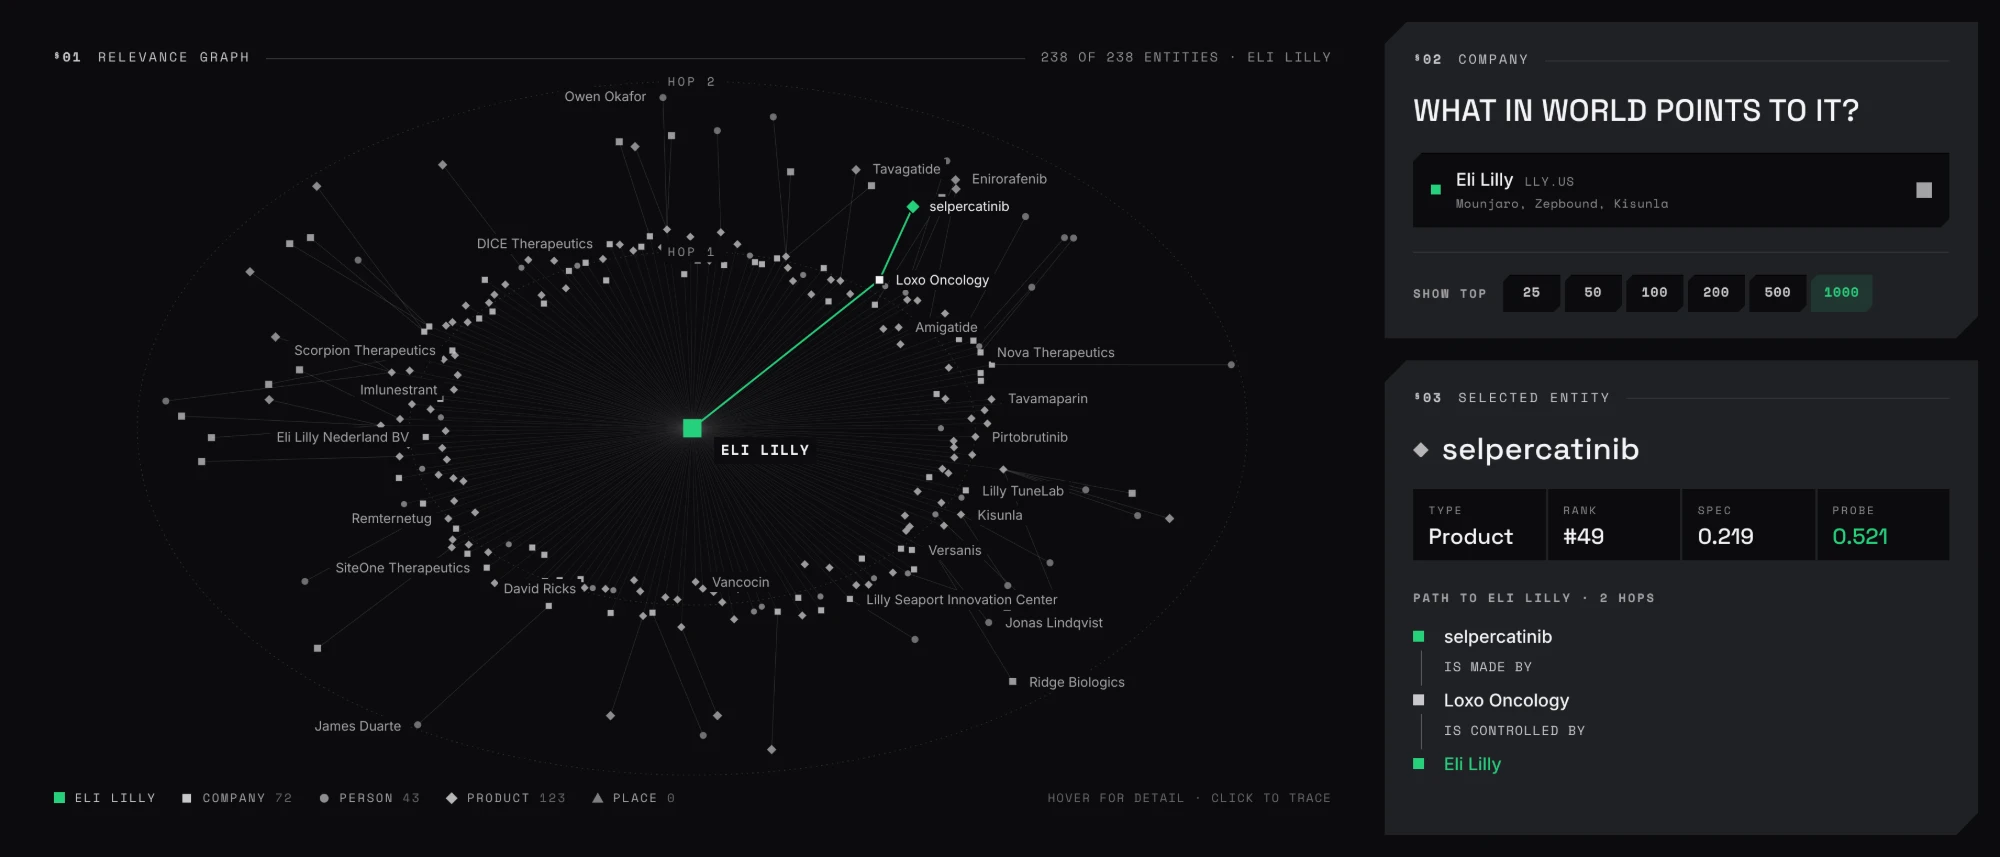
A knowledge graph is a web linking important concepts like people and companies based on how often they are mentioned together. The nodes in the knowledge graph are the entities our NER found. The edges between them are inferred from co-mentions. For example, when NVIDIA (ORG) is co-mentioned often enough with Blackwell (PRODUCT), those two nodes are connected using an edge. The strength of the connection between two nodes is proportional to the frequency-adjusted probability of them co-occurring.
Point-in-time means that every connection in a knowledge graph was knowable at that specific moment. A 2018 view, for example, is built entirely from information available during that year to ensure the graph remains safe for backtesting. When future knowledge seeps into the past, it creates lookahead bias. For instance, if a model evaluating 2007 data already knows the newly announced iPhone will become a massive commercial success, its predictions rely on impossible foresight rather than historical reality.
How It Works
We treat edge formation as a link discovery problem. For a company, a year and a candidate entity, we count how many events co-mention them, then compare that against how often it appears across all news that year. That comparison is lift:
lift = (co / target_events) / (entity_events / total_events)
Lift of 1.0 is chance. Higher means the pair co-occurs more than chance would predict. Ubiquitous entities like "United States" appear everywhere, so their lift against any one company is near 1.0 and they fall away. A specific pairing like NVIDIA and Blackwell scores high: Blackwell was co-mentioned with NVIDIA in 69 of NVIDIA's 2,651 events in 2024 and appeared in only 75 events in the whole corpus that year, which works out to roughly 780 times chance.
Raw co-mention counts alone would just surface whatever is loudest, so lift does the real work, and a normalized version of it lets a strong link on a rare product rank alongside one on a common name. Before ranking we tidy the entities: surface forms are canonicalized, so Apple, Apple Inc. and apple collapse to one node and a lone surname folds into the fuller name kept that year.
The point-in-time property is enforced by bucketing every edge on its document date and scoring it against the same year's background, with no cumulative or forward-looking state. Sampling edges at random and pulling the underlying source documents back from the database, all of them fall inside the year the edge belongs to: 24 of 24 in the last run, across 955 real documents.
NOSIBLE World supplies the raw material. It turns the article stream into one record per real event, however many outlets cover it, and each record carries a date, its NER entities, resolved company tickers, a coverage count of distinct publishers, and an embedding of its meaning. For this proof of concept we scanned every daily slice from 2015 to mid 2026 and pulled the events that mention NVIDIA, Apple or Coca-Cola: 88,359 in all. Across the period that resolves to 332 distinct products for NVIDIA and 274 for Apple, along with hundreds of people, organizations and places for each company. The matrices below show only the strongest of them.
Here is one such record, the January 2022 Microsoft and Activision Blizzard deal, abridged to the fields this post uses. The full event also carries an embedding of its meaning, a twenty-facet ontology (GICS, IPTC and NOSIBLE event types among them), per-publisher provenance, and identifiers for each ticker (ISIN, LEI, FIGI), all left out here for length.
{
"event": {
"date": "2022-01-18",
"title": "Microsoft Acquires Activision Blizzard in $68.7 Billion Gaming Deal",
"country": "United States"
},
"signals": { "sentiment": "positive", "materiality_score": 0.83 },
"coverage": { "total_coverage": 2740, "total_netlocs": 2392 },
"entities": {
"PERSON": { "Bobby Kotick": 22, "Phil Spencer": 15, "Satya Nadella": 6 },
"ORG": { "Microsoft": 202, "Activision Blizzard": 157, "Xbox": 26 },
"GPE": { "United States": 3, "California": 3 },
"PRODUCT": { "Call of Duty": 20, "Xbox Game Pass": 6, "Playstation": 3 }
},
"tickers": [
{ "name": "Microsoft Corporation", "ticker_eodhd": "MSFT.US" },
{ "name": "Activision Blizzard Inc", "ticker_eodhd": "ATVI.US" },
{ "name": "Sony Corp", "ticker_eodhd": "6758.TSE" }
]
}Worked Examples
We show each company the same way: first its force-directed network for one year, where nodes are the entities it was co-mentioned with and lines join entities that also co-occur with each other, so related nodes cluster; then the matrix that best tells its story over time. The networks colour nodes by category and the matrices colour by trend, green where a share grew, white where it held, red where it shrank.
NVIDIA
NVIDIA's 2024 network splits into the groups the news runs together: the memory and foundry supply chain, the accelerator platform of GeForce, GPU and Blackwell, and the AI cloud of Microsoft, Google and OpenAI, with AMD and Intel as the peers.
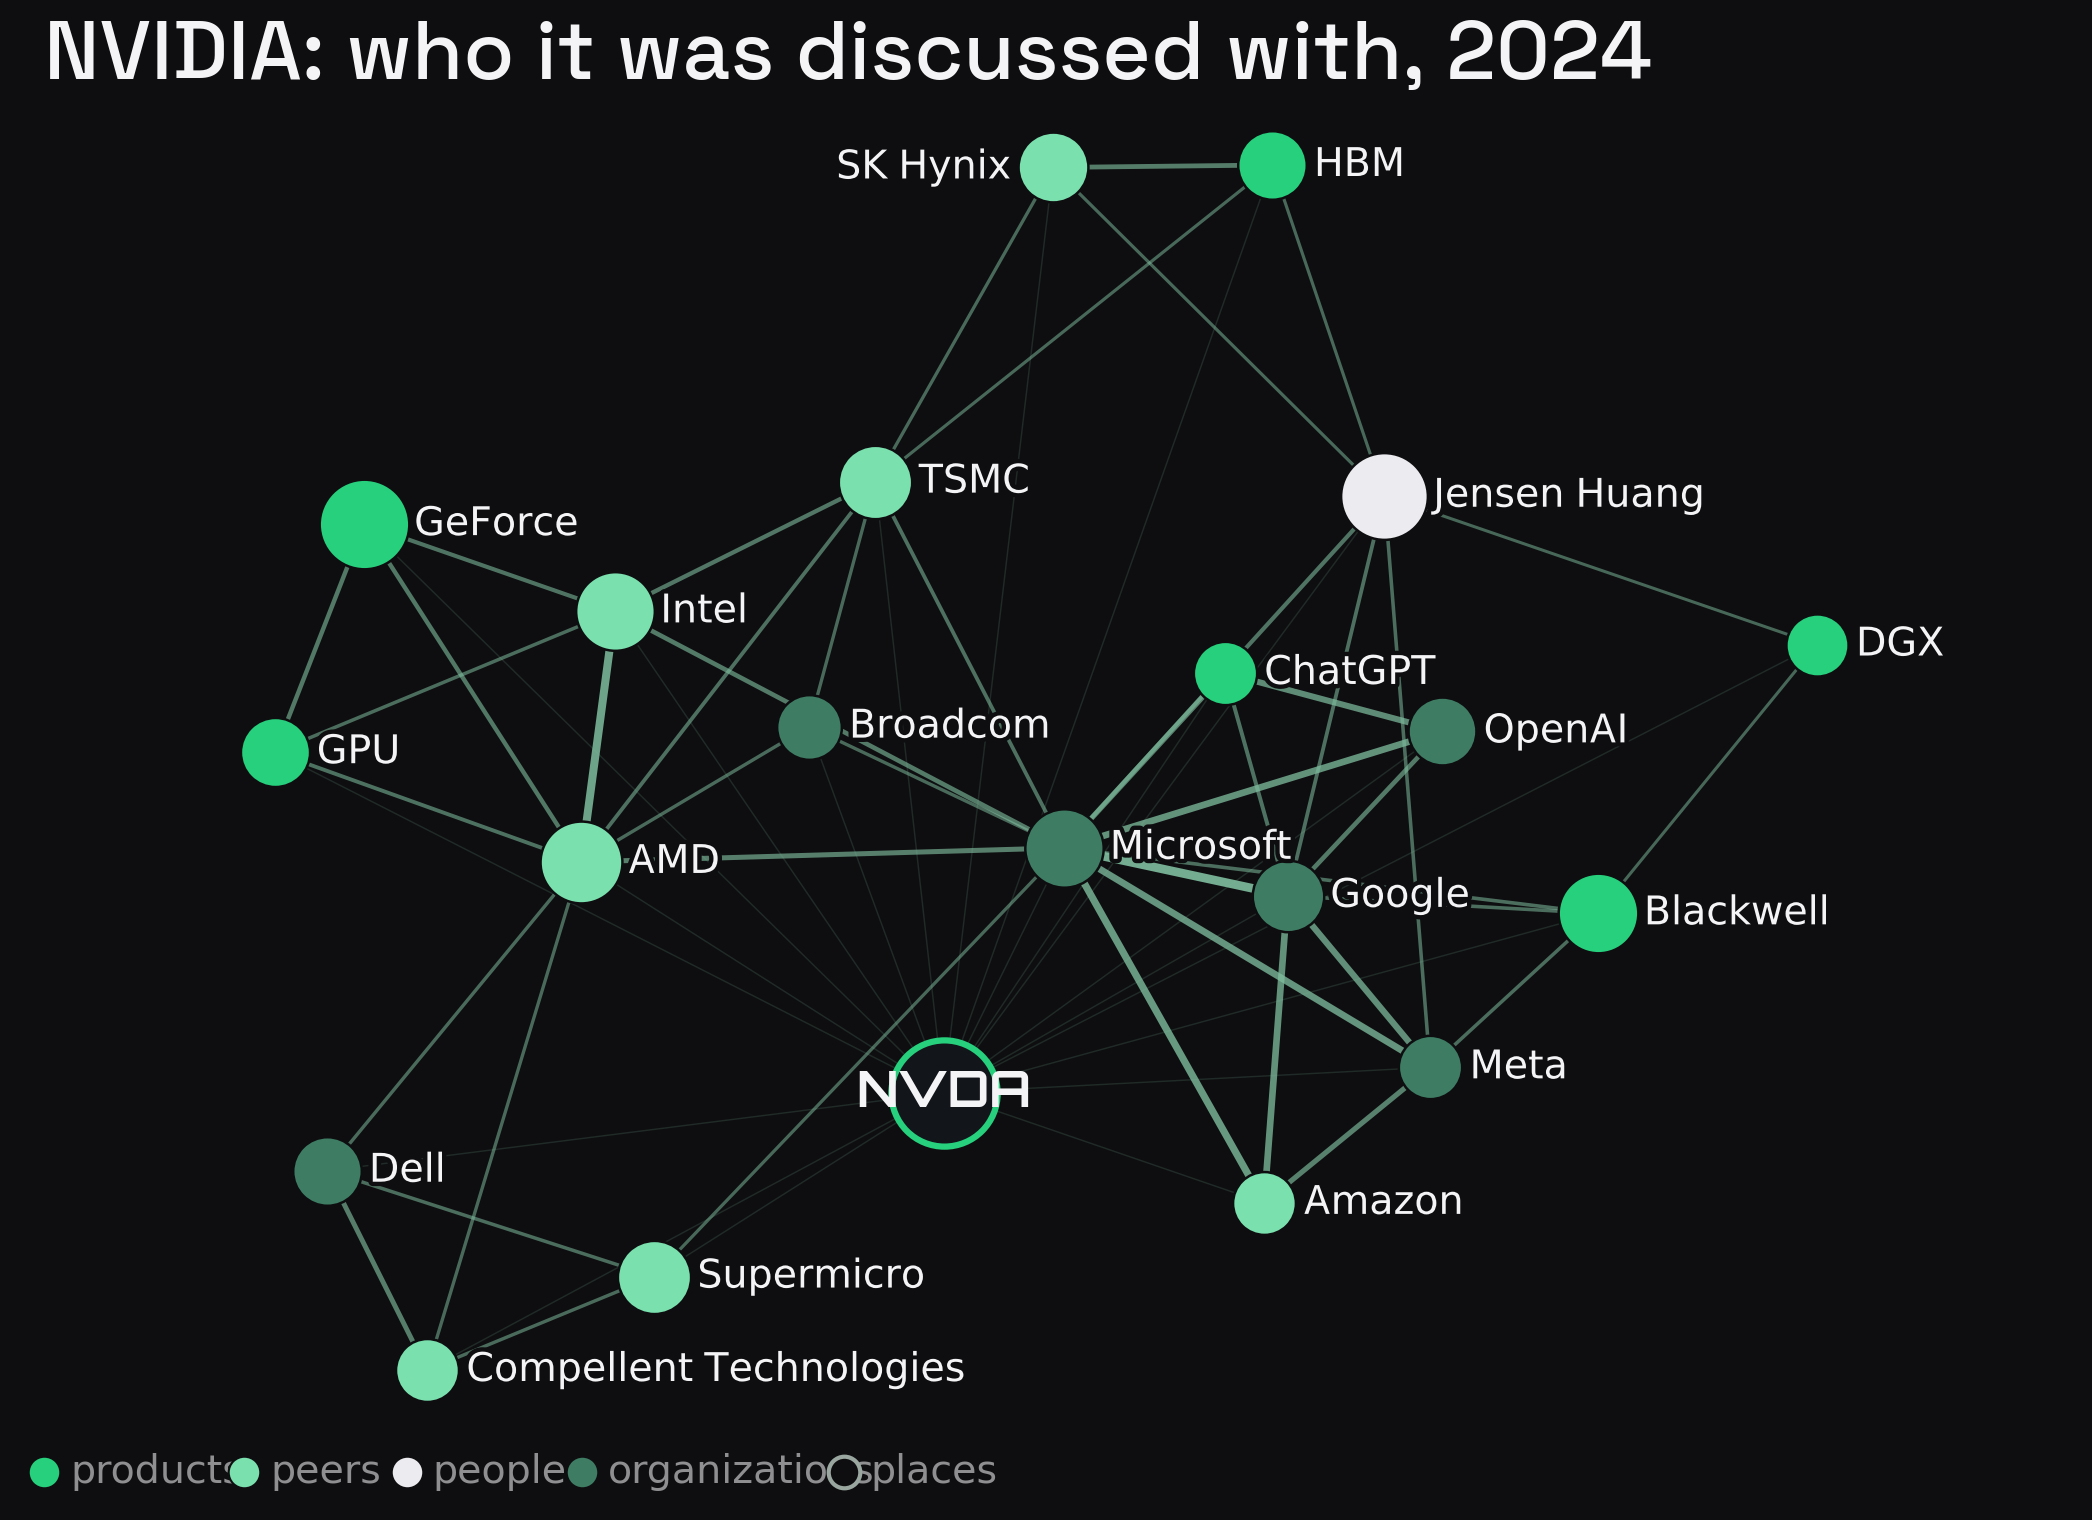 NVIDIA's 2024 co-mention network. Nodes are entities co-mentioned with NVIDIA; lines join entities that co-occur with each other, so related nodes cluster. Brand green marks products, lighter green peers, mist people, muted green organizations, an outline places; size is association strength. The supply chain, the accelerator platform and the AI cloud each form a group. Built from news on or before 31 December 2024.
The product matrix then shows the roadmap arriving on cue, each product entering the year the news starts to discuss it: RTX in 2018, DLSS in 2019, the A100 in 2020, then Blackwell, HBM and the H200 in 2024.
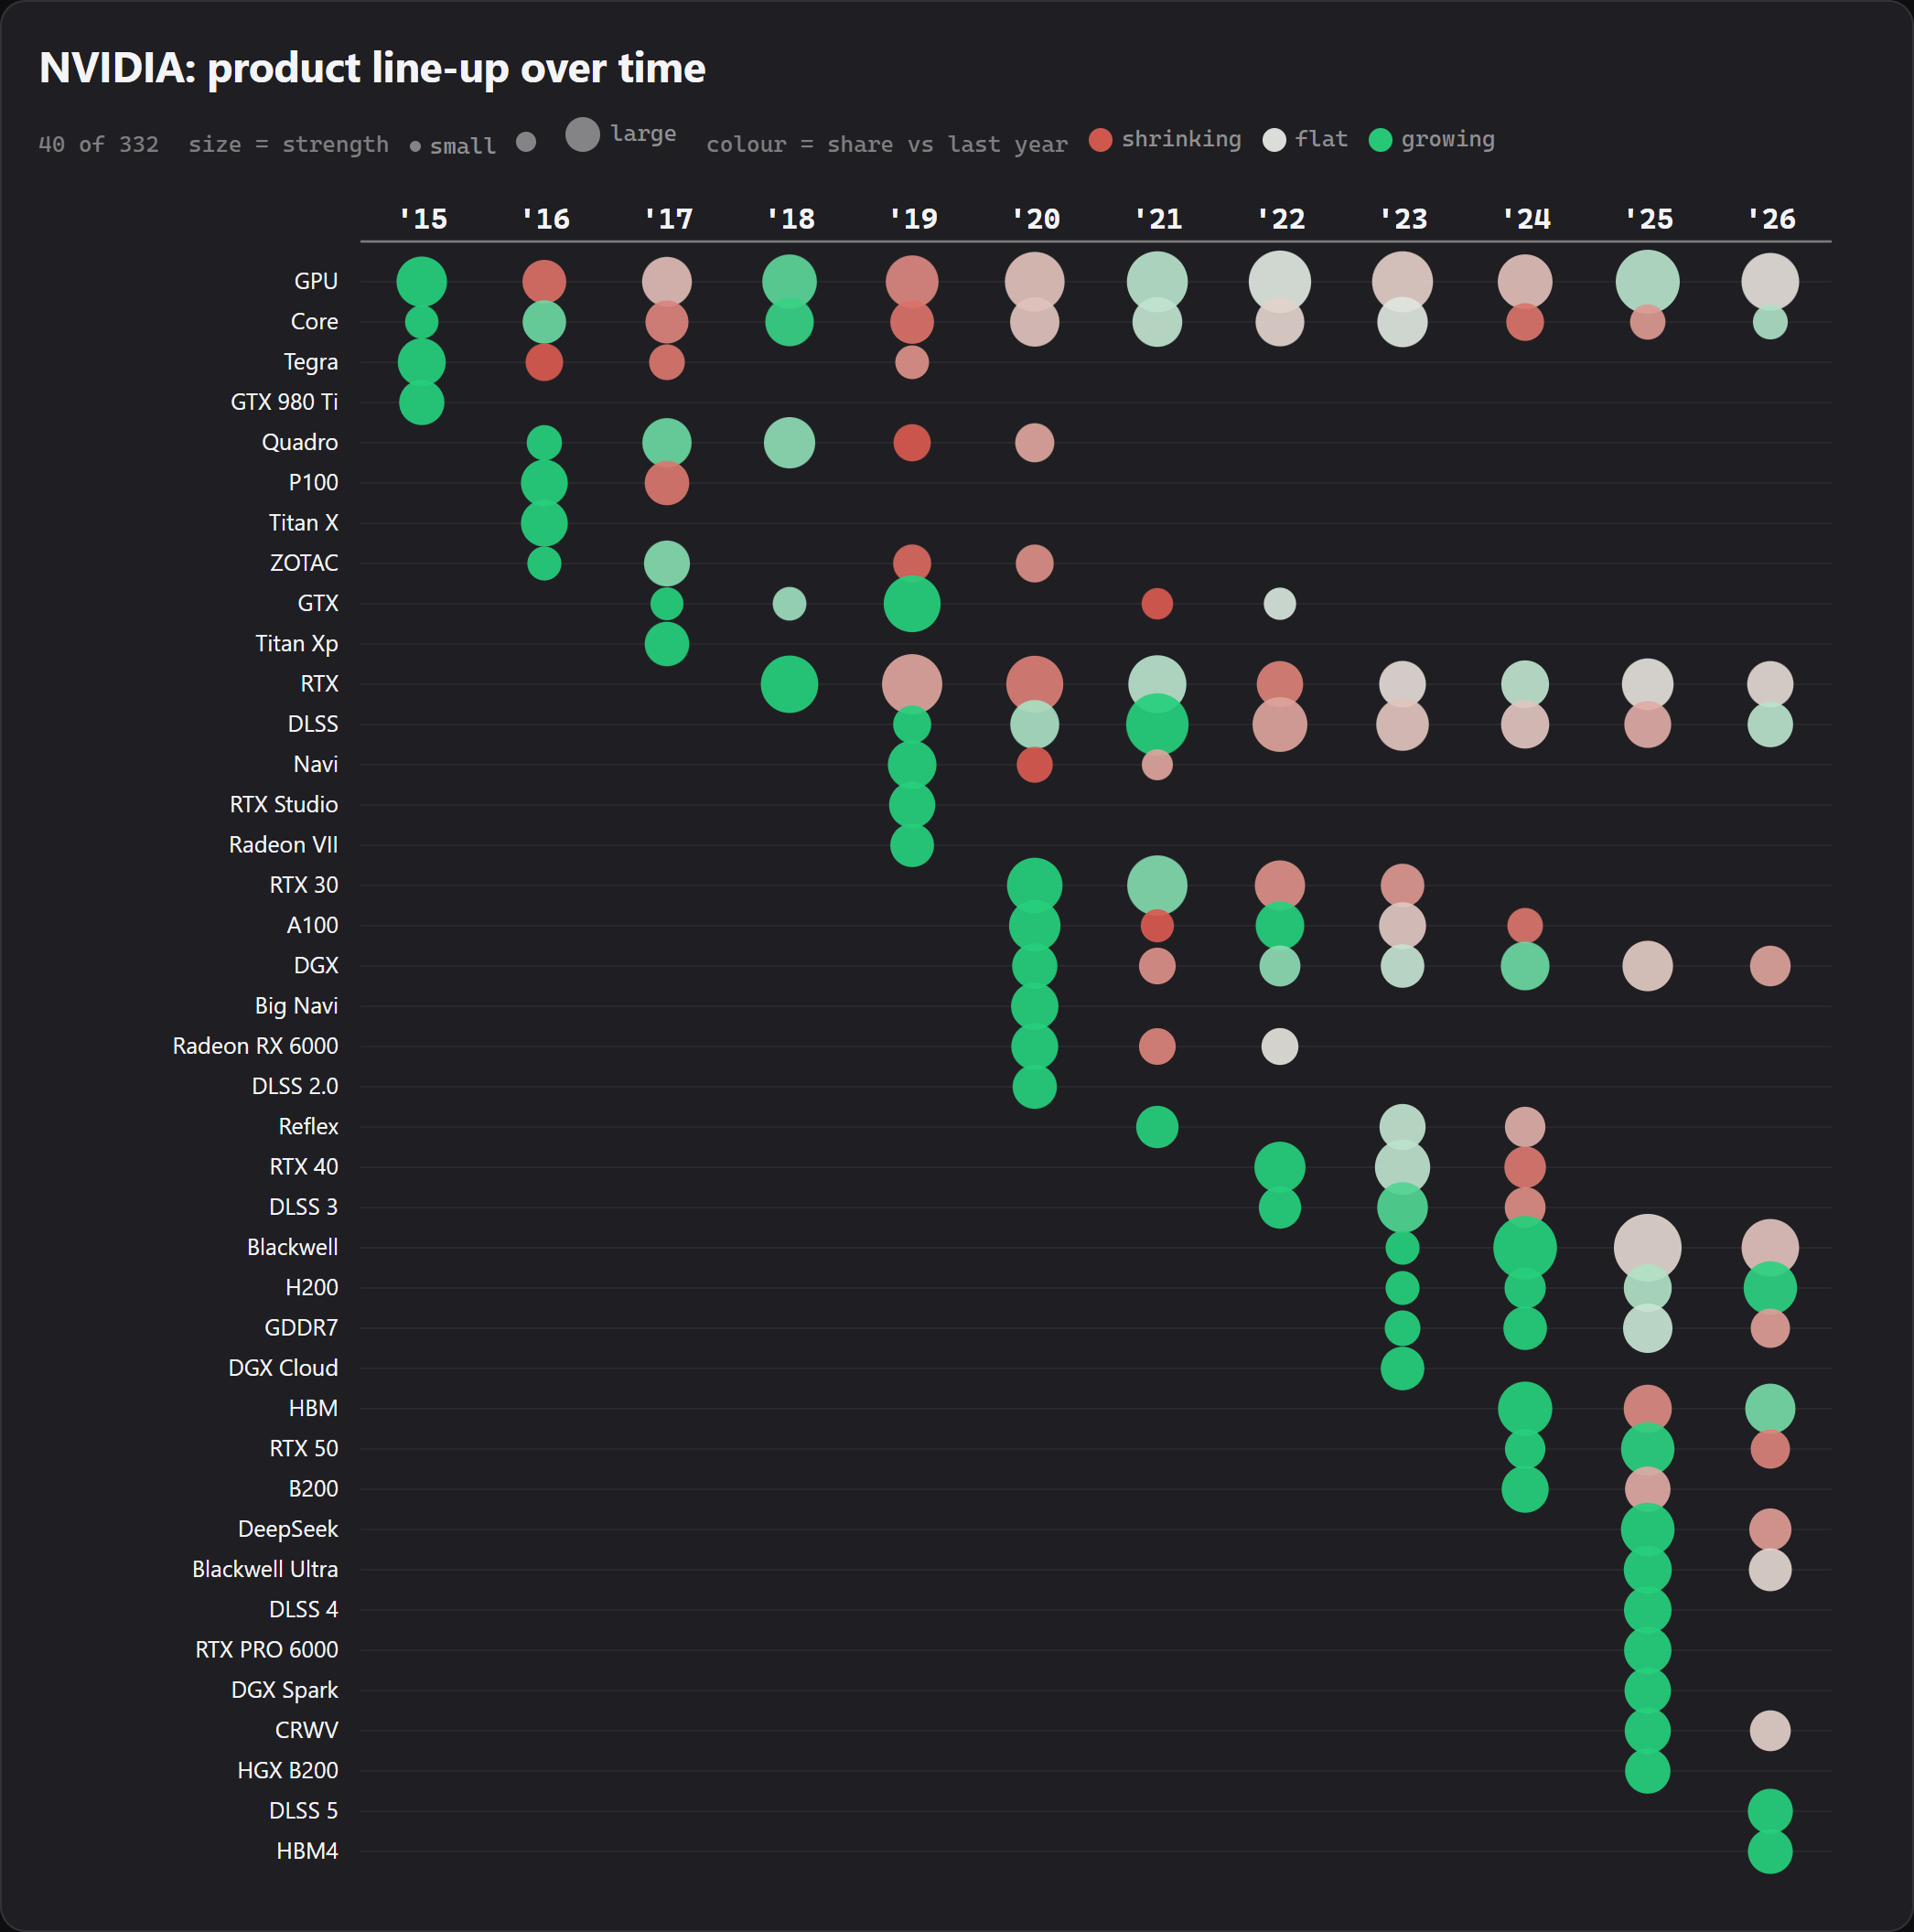 The NVIDIA product line-up over time, showing 40 of the 332 products NVIDIA is co-mentioned with. Dot size is that year's association strength; colour is how the product's share of NVIDIA's coverage changed from the year before, green for growing, red for shrinking, neutral for flat. RTX enters in 2018, the A100 in 2020, and Blackwell, HBM and the H200 arrive in 2024.
Apple
Apple's 2024 network centres on its own product line, the iPhone, iPad, the Pro and Pro Max and Vision Pro, ringed by peers, the people who cover it, and the platforms it competes and partners with.
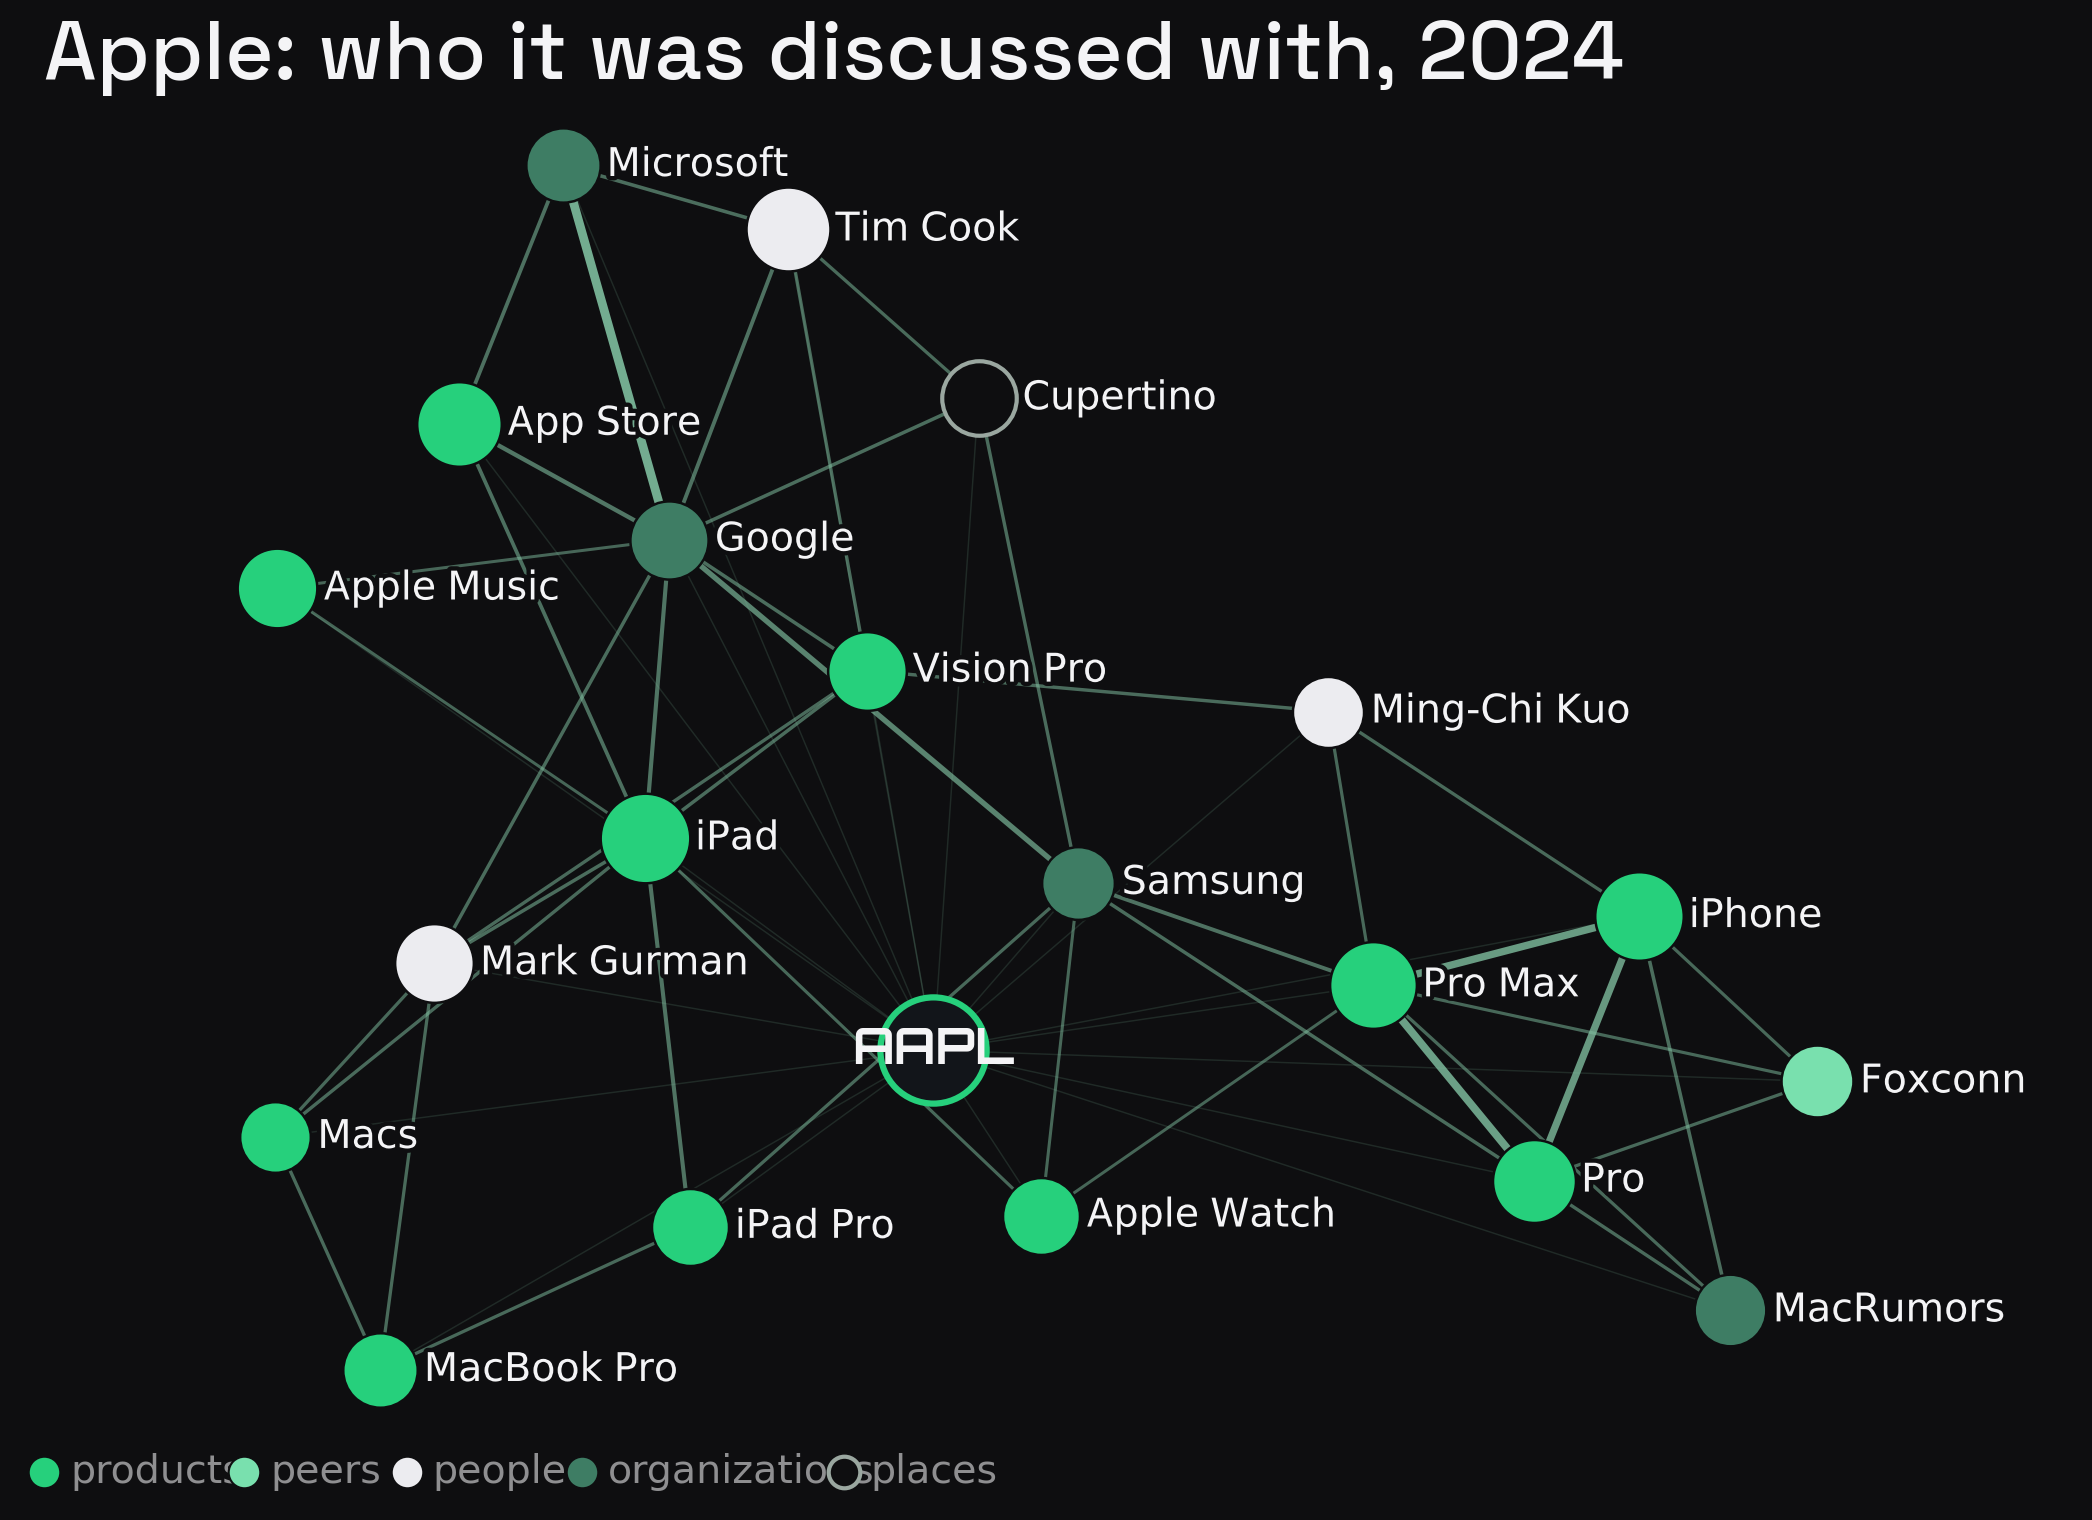 Apple's 2024 co-mention network, drawn the same way. Its product line sits at the centre, ringed by peers such as Samsung and Foxconn, the analysts and executives who cover it (Tim Cook, Mark Gurman, Ming-Chi Kuo), and the platforms it competes and partners with (Google, Microsoft, Spotify). Built from news on or before 31 December 2024.
The product matrix traces the arc over time: the iPhone and iPad run throughout, the Apple Watch and AirPods arrive in the mid 2010s, the Pro Max line follows from 2019, then Vision Pro in 2025.
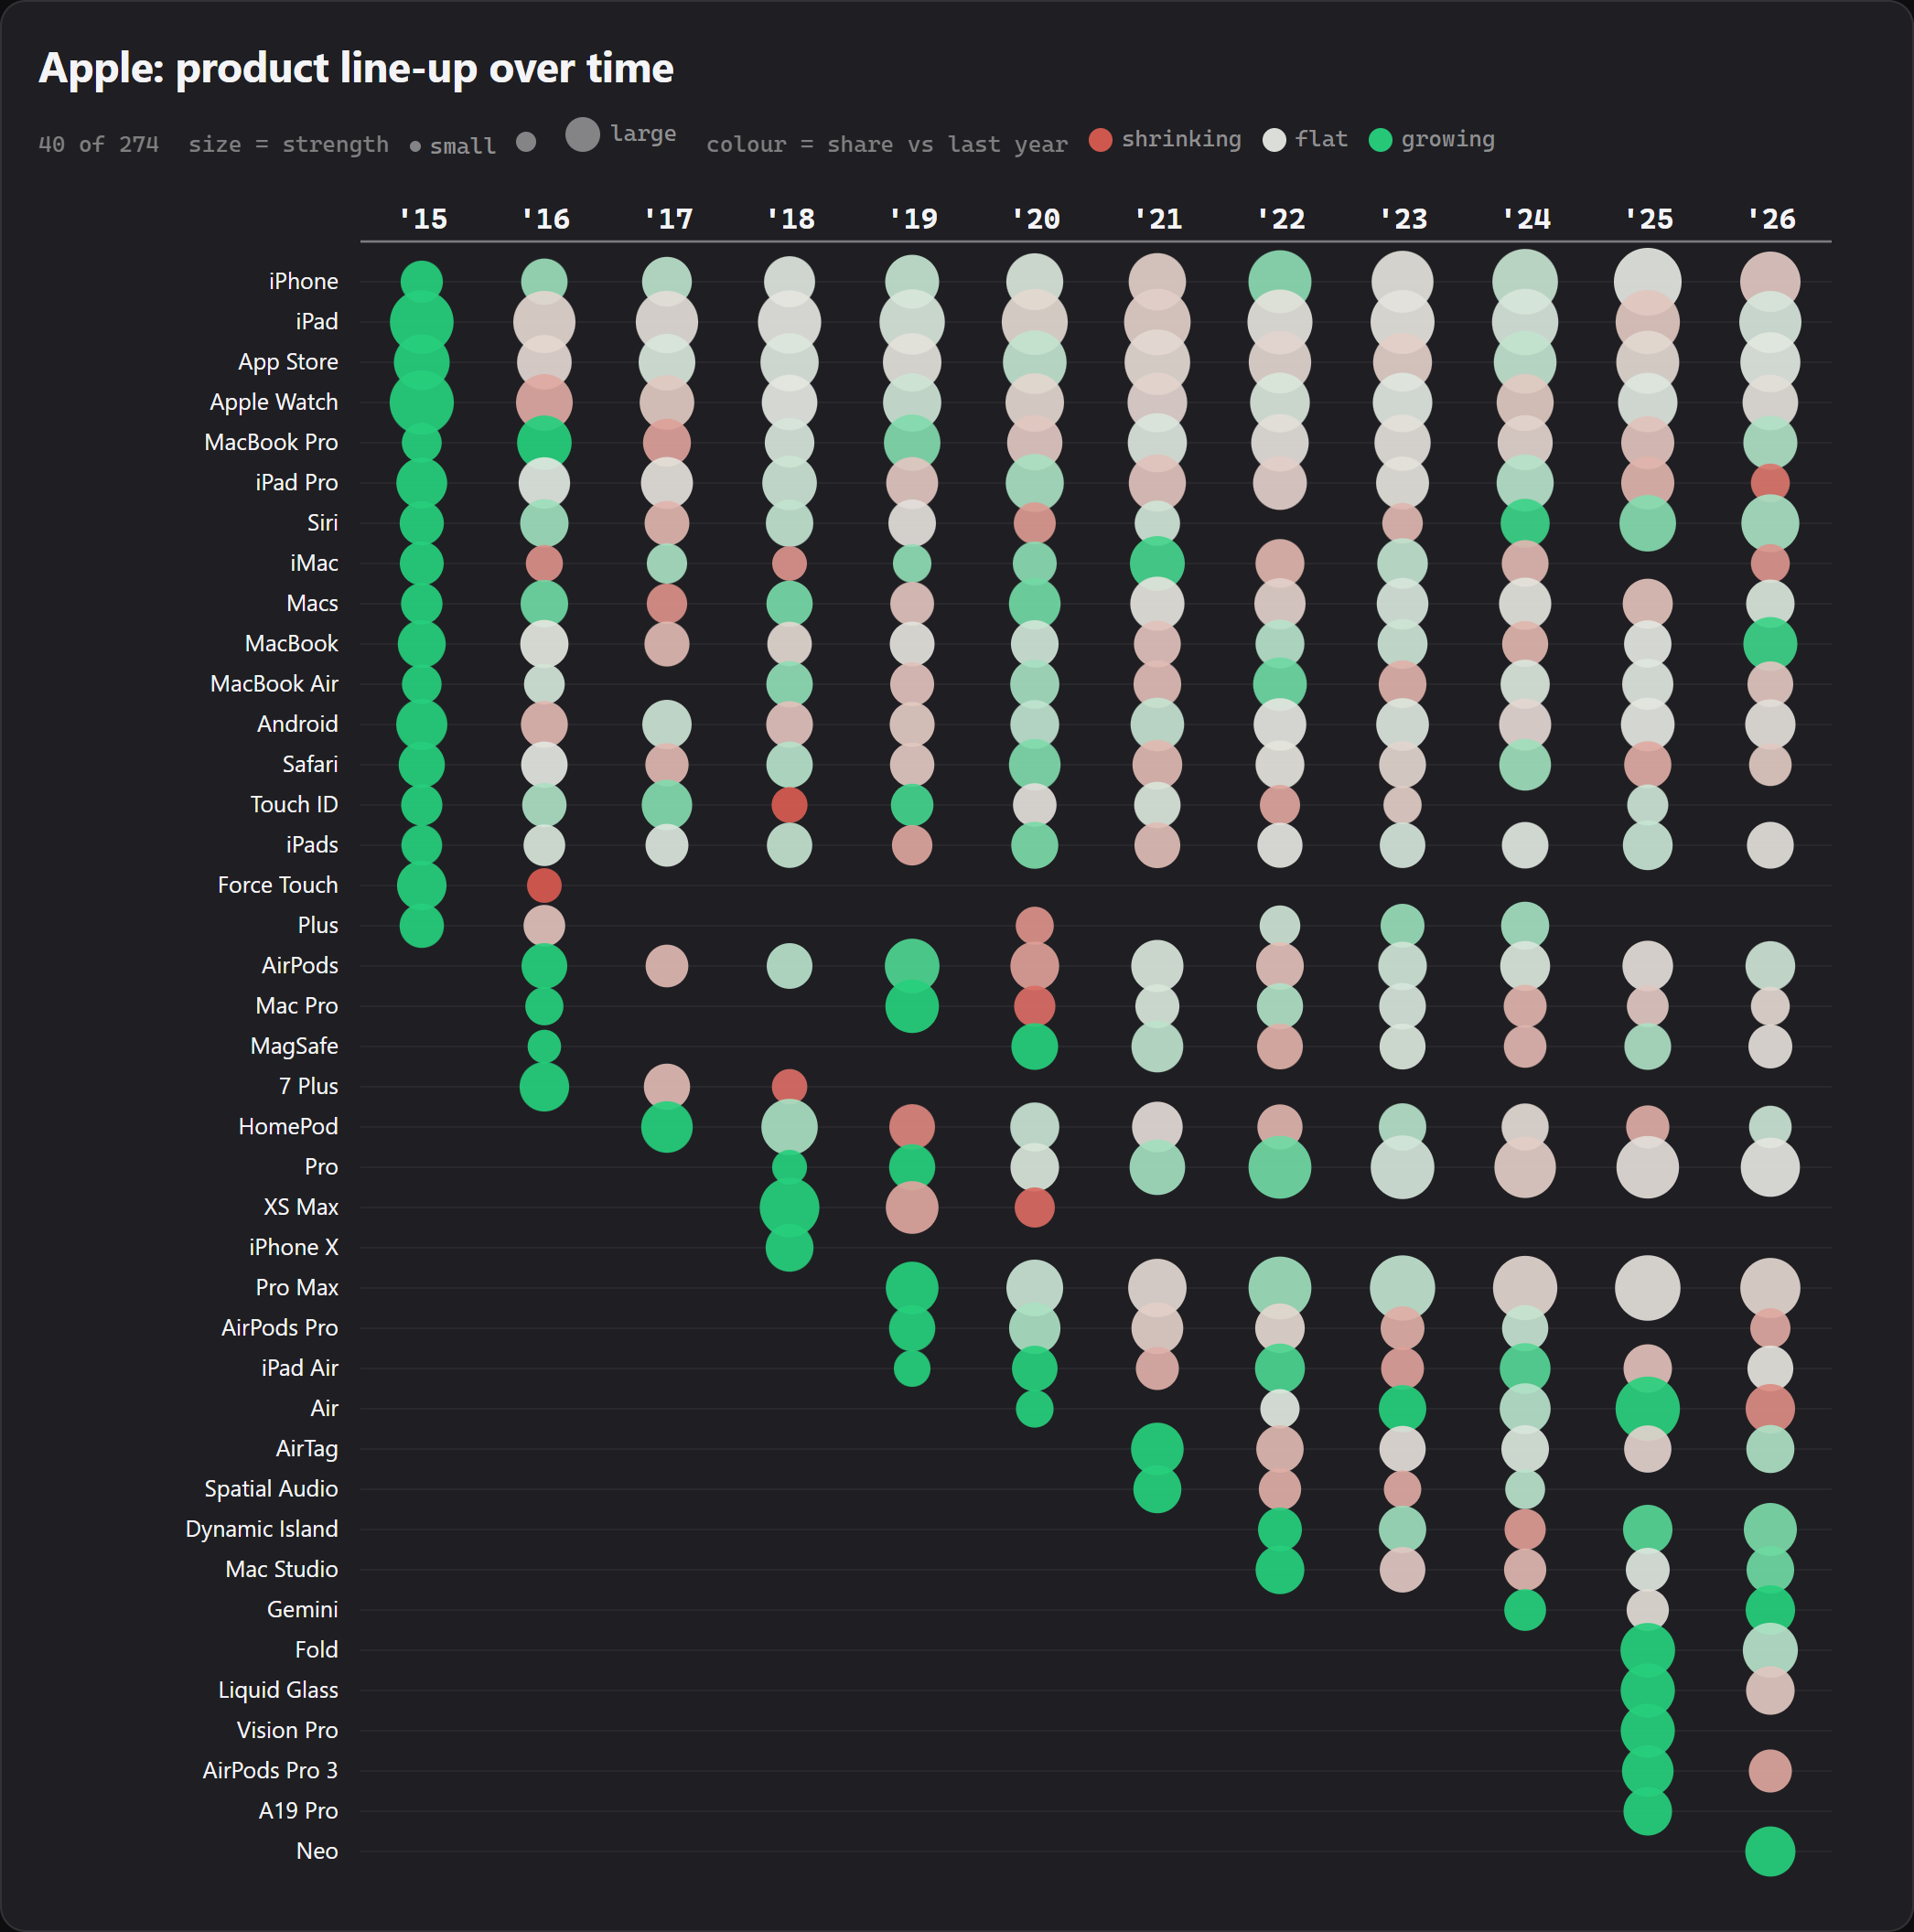 Apple's product line-up over time, 40 of 274 products, drawn the same way. The iPhone, iPad and App Store run throughout; the Apple Watch and AirPods arrive in the mid 2010s, the iPhone X in 2018, AirPods Pro and the Pro Max line from 2019, then AirTag and Dynamic Island, and Vision Pro in 2025.
Coca-Cola
Coca-Cola's 2021 network is its own world: the bottling system on one side, the beverage competitors from PepsiCo to Anheuser-Busch on another. The lower cluster is a single news story, the backlash to Georgia's 2021 voting law, when Coca-Cola and Delta criticized it and Major League Baseball moved its All-Star Game out of Atlanta, which is why Georgia, Atlanta, Delta and the MLB sit together.
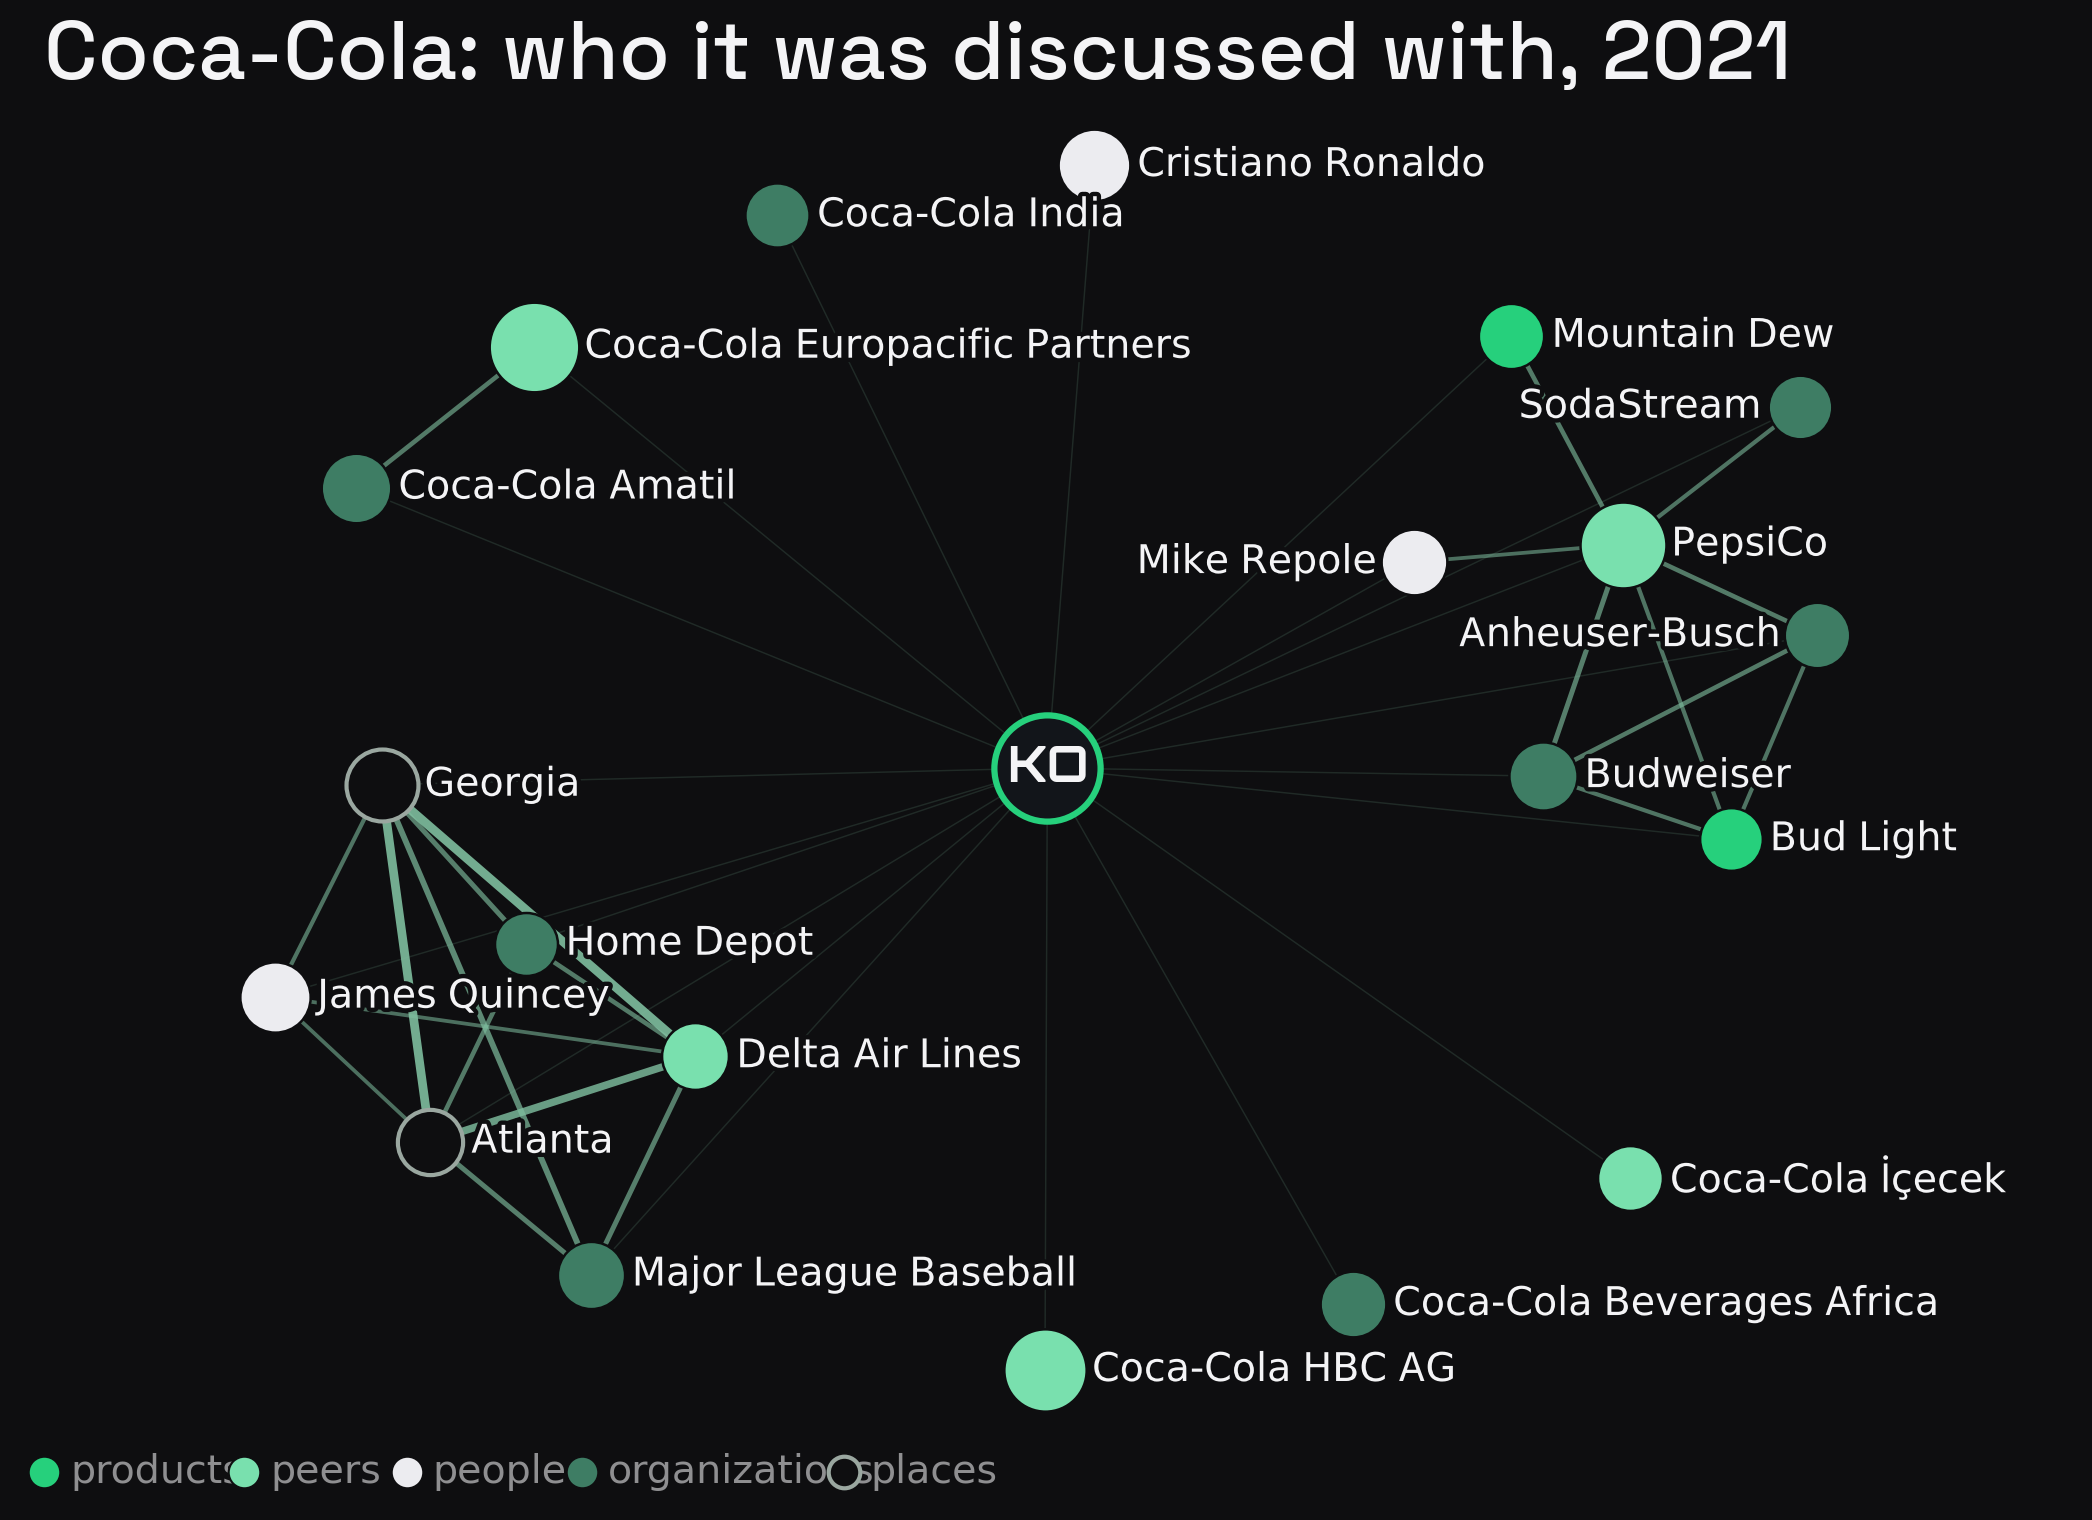 Coca-Cola's 2021 co-mention network, drawn the same way. The bottling system clusters on one side and the beverage competitors on another. The lower group is the backlash to Georgia's 2021 voting law, when Coca-Cola and Delta criticized it and Major League Baseball pulled its All-Star Game from Atlanta, so Georgia, Atlanta, Delta and the MLB appear together. Built from news on or before 31 December 2021.
Its best story is in people. The chief-executive handover from Muhtar Kent to James Quincey reads straight off the news, and Mark Zuckerberg appears once, in 2020, from the advertising boycott Coca-Cola led.
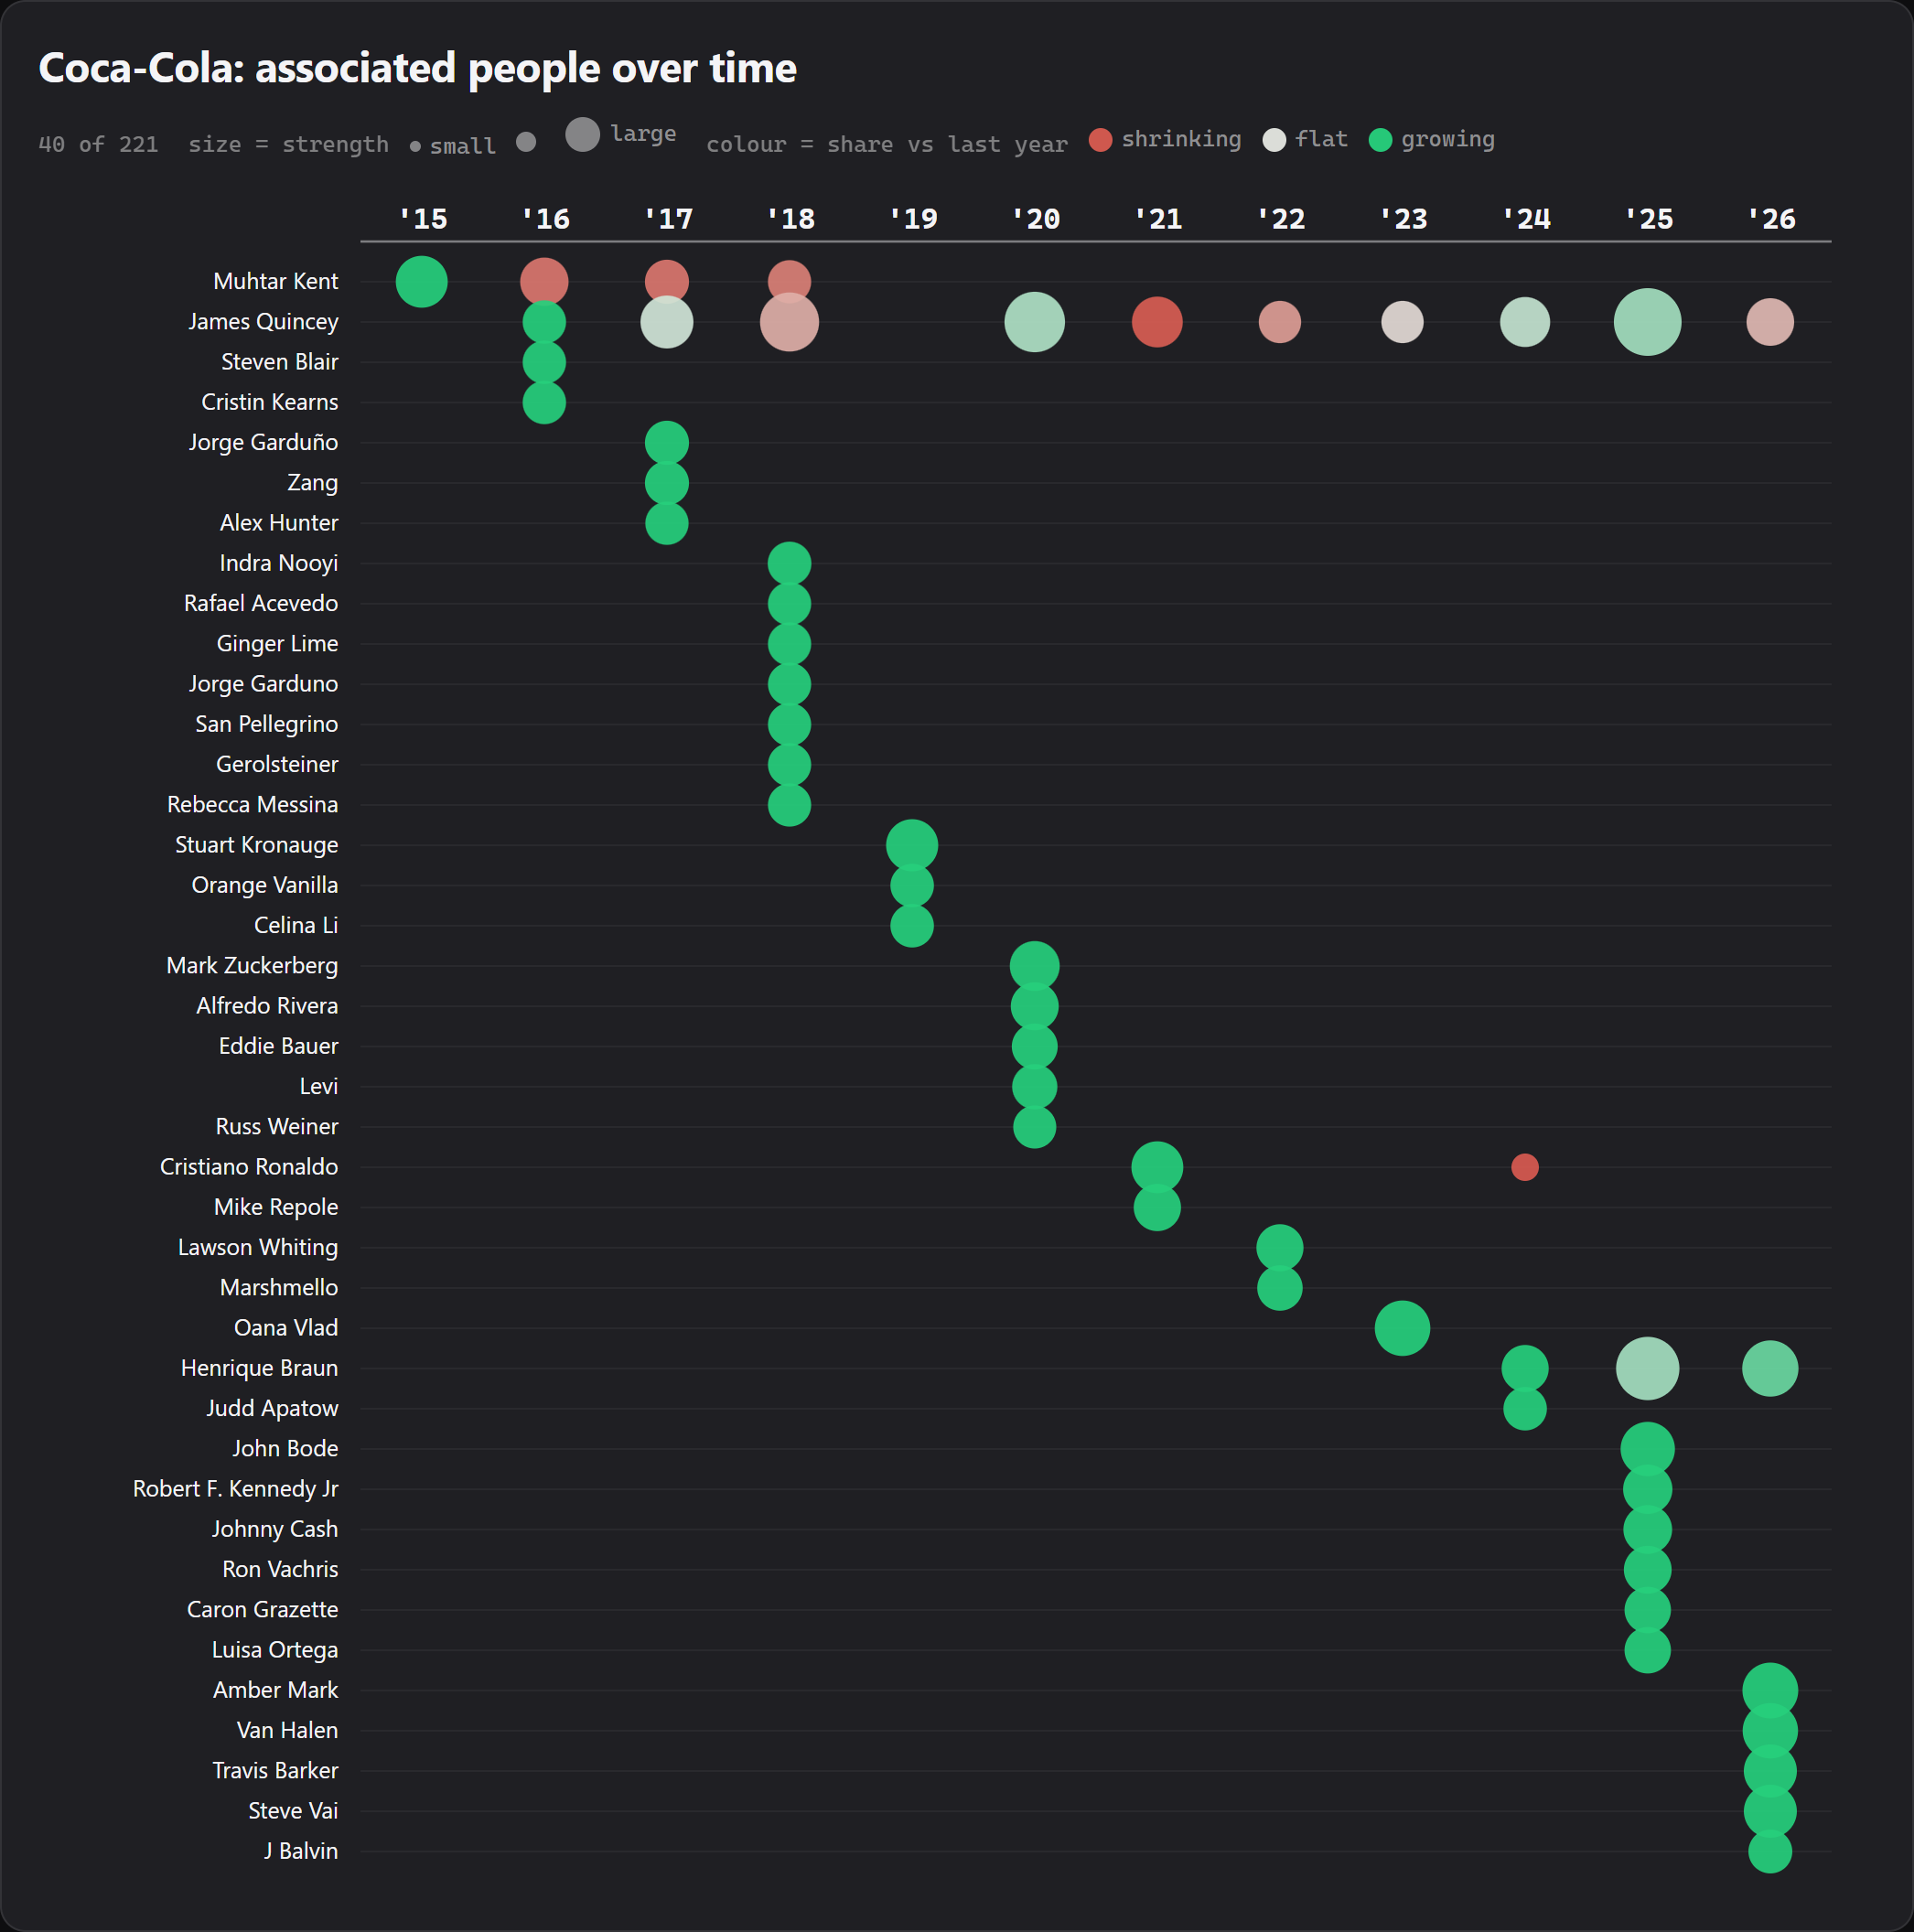 Coca-Cola's associated people over time. Muhtar Kent is present from 2015 to 2018, James Quincey from 2016 on, and Cristiano Ronaldo shows up as a single spike in 2021, the year of his Euro 2020 press-conference moment.
Run It on Any Company
The same pipeline runs over any company with a ticker in NOSIBLE World. Pick a company, choose the entity layers that matter, products for a roadmap, people for the cast, peers for the competitive set, and you get a point-in-time knowledge graph that is safe to backtest, because every edge is stamped with the date it became knowable. NOSIBLE World turns the world's news into a structured, multilingual, de-duplicated event database, one record per real event, with dates, entities, tickers and embeddings already resolved. If you want access to the data, or a graph like this built for your own universe, start a trial or explore the live data at nosible.world.
Appendix: Build It Yourself
The core of the pipeline is two short functions and a scoring line, shown here as one runnable script. It starts from an event as NOSIBLE World stores it, with entities grouped by type and a mention count per name; counts co-mentions per year, bucketed by the event date so the view is point-in-time by construction; and scores a candidate edge by lift, reproducing the NVIDIA and Blackwell pairing from earlier.
import collections


def co_mentions_by_year(
    events: list[dict],
    target_ticker: str,
    entity_type: str
) -> dict:
    """
    Count, per year, the events mentioning both a target company and each entity.

    :param events: NOSIBLE World events, each with a date, tickers and entities.
    :param target_ticker: EODHD ticker of the company at the centre of the graph.
    :param entity_type: NER layer to read, for example "PRODUCT" or "PERSON".
    :return: Mapping of year to a Counter of entity name to co-mention count.
    """
    per_year = collections.defaultdict(collections.Counter)
    for event in events:
        tickers = {ticker["ticker_eodhd"] for ticker in event["tickers"]}
        if target_ticker not in tickers:
            continue
        year = event["date"][:4]
        for name in event["entities"].get(entity_type, {}):
            per_year[year][name] += 1
    return per_year


def lift(
    co: int,
    target_events: int,
    entity_events: int,
    total_events: int
) -> float:
    """
    Association strength of a co-mention versus chance in one period.

    :param co: Events mentioning both the target and the entity.
    :param target_events: Events mentioning the target.
    :param entity_events: Events mentioning the entity, the background.
    :param total_events: All events in the period.
    :return: Lift, where 1.0 is chance and higher is a stronger association.
    """
    return (co / target_events) / (entity_events / total_events)


# A simplified event. The real NOSIBLE World record (shown earlier) nests the date
# under an "event" object and also carries signals, coverage, an embedding and an
# ontology; this toy keeps only what the two functions read.
event = {
    "date": "2024-03-18",
    "tickers": [{"ticker_eodhd": "NVDA.US", "name": "NVIDIA"}],
    "entities": {
        "PRODUCT": {"Blackwell": 7, "GPU": 4},
        "PERSON": {"Jensen Huang": 3},
        "ORG": {"AMD": 2},
        "GPE": {"Taiwan": 2}
    }
}

# Count co-mentions per year, bucketed by the event date, so the view is
# point-in-time by construction.
per_year = co_mentions_by_year(
    events=[event],
    target_ticker="NVDA.US",
    entity_type="PRODUCT"
)

# Score the NVIDIA and Blackwell edge for 2024 by lift, the pairing from above.
# The result is about 780: the pair co-occurs roughly 780 times more than chance
# in 2024, so the edge is kept.
score = lift(
    co=69,
    target_events=2651,
    entity_events=75,
    total_events=2249039
)
Announcing Atlas: The Point-in-time Knowledge Graph
The Hidden Path to Every Ticker: 15% to 22% Coverage, Zero Look-Ahead