Turning News into a Risk-On/Risk-Off Equity Signal
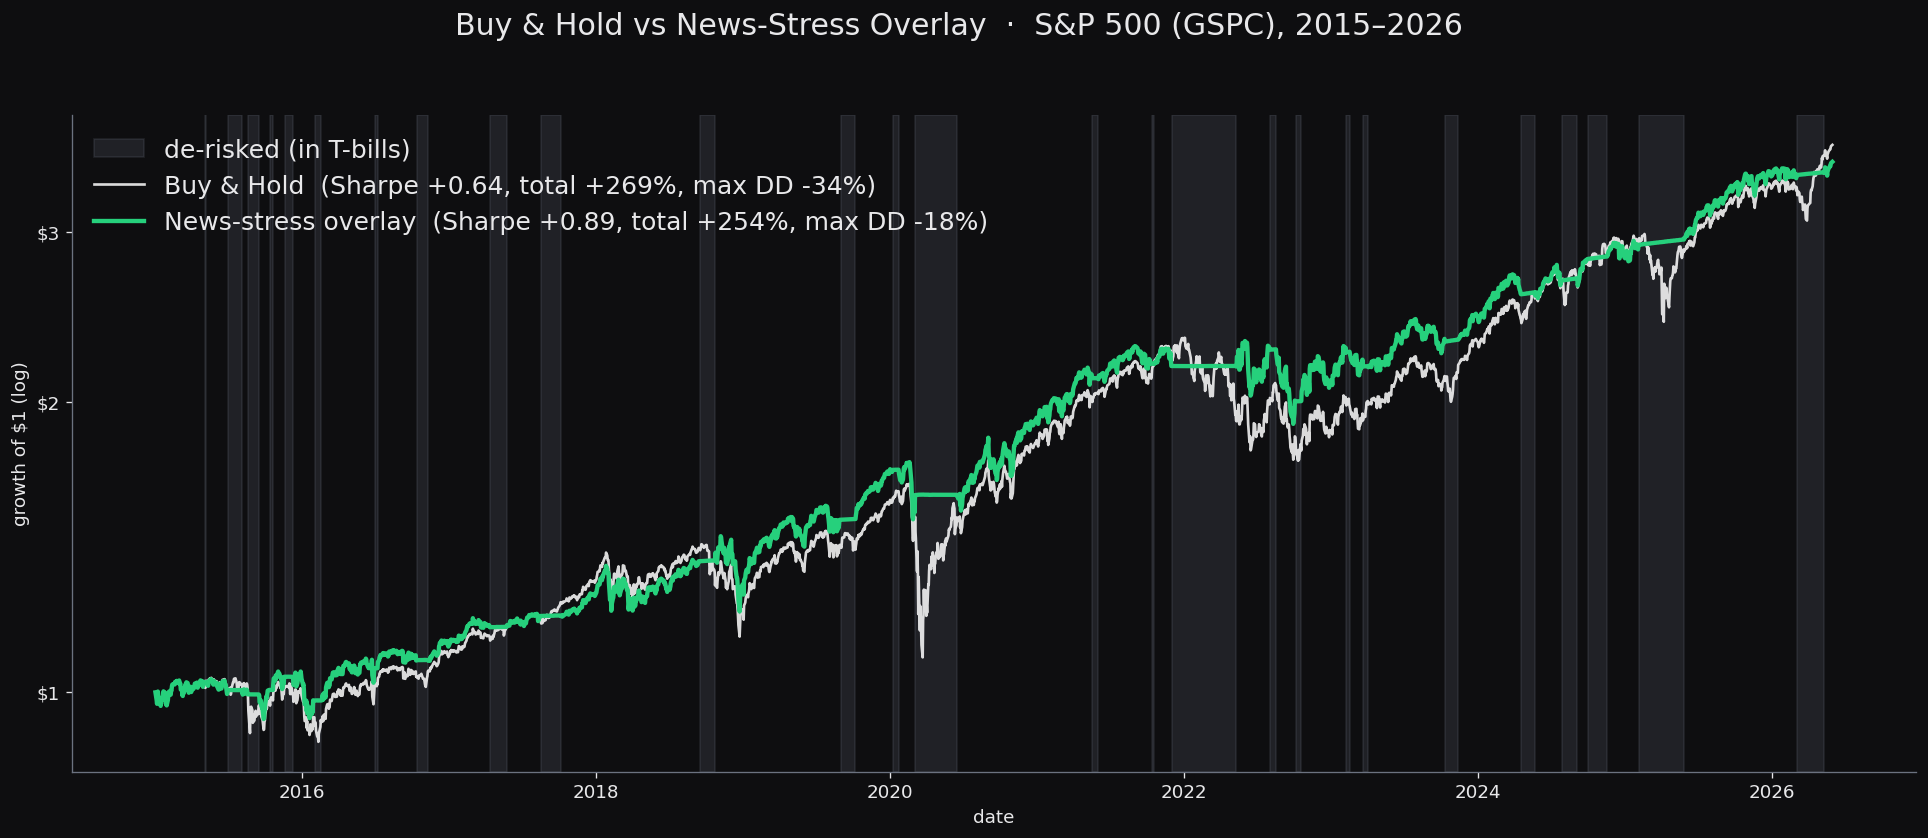
We built a risk-on/risk-off trading signal from the NOSIBLE event database. Each day it measures how much of the global news flow is about market-stress themes, holds equities when that reading is low, and moves to T-bills when it spikes. We selected the parameters on 2010 to 2013 and tested on an untouched 2015 to 2026 window. On the S&P 500 the signal held buy-and-hold's total return (+254% versus +269%) while cutting the maximum drawdown from −34% to −18%, which raised the Sharpe ratio from 0.64 to 0.89. Five years into that test it stepped out of equities ahead of the 2020 COVID crash and back in as it passed, and the same rule transfers unchanged to the Nasdaq and the Russell 2000.
The point is risk, not return: roughly the same long-run return with a much smaller drawdown. Everything below is enough to rebuild the signal, the rule, and the backtest from this post and the NOSIBLE event database alone.
The signal: a daily stress reading from the news
The signal uses three fields the database already stores on every event: its embedding (oai_vector, from OpenAI text-embedding-3-large), the number of distinct publishers that covered it (total_netlocs), and its date. Events are de-duplicated, so one real event is one record however many outlets run it.
We define market stress as 17 short concepts and embed each once with the same model. The phrases are entity- and time-agnostic (no specific countries, crises, or dates) so no hindsight enters the backtest. The stored vectors are the full 3,072-dimensional text-embedding-3-large embedding, but the model is trained with Matryoshka representation learning, so the first 1024 dimensions are themselves a complete embedding. We use those: truncate both the event vectors and the anchors to the first 1024 dimensions, then L2-renormalise. The 17 anchors, verbatim:
credit_spreads     Widening corporate credit spreads, surging default risk and stress in corporate bond markets
liquidity          A liquidity crisis or funding stress freezing financial markets
deleveraging       Forced selling, margin calls, deleveraging and liquidations cascading through markets
recession          Rising fears of recession, sharp economic slowdown or collapsing growth
banking_credit     A banking crisis, credit crunch, defaults or financial-system instability
volatility_fear    A surge in financial market volatility, fear, panic and investor anxiety
equity_selloff     A sharp sell-off, crash or plunge in global stock markets
flight_to_safety   A flight to safety and risk-off panic: investors dumping risky assets for government bonds, gold and reserve currencies
sovereign_fx       A sovereign-debt default or currency crisis destabilising markets
monetary_shock     An unexpected hawkish central bank or interest-rate shock tightening financial conditions
rates_turmoil      Turmoil in government bond markets: a bond rout, spiking yields and surging interest-rate volatility
tail_hedging       Investors rushing to buy downside protection and hedge against a market crash; spiking demand for portfolio insurance
earnings_distress  A wave of corporate profit warnings, earnings misses, bankruptcies and corporate distress
employment_shock   A labour-market shock: surging unemployment, mass layoffs or a sharply weakening jobs report
tariffs            New import tariffs, escalating protectionism and a trade war between major economies
natural_disaster   A major natural disaster, extreme-weather catastrophe or critical-infrastructure failure disrupting the economy
war_conflict       The outbreak or escalation of war, military conflict or a major geopolitical security crisis
For an event e, relevance(e) is the highest cosine similarity between its stored embedding and any of the 17 anchors, and breadth(e) is its total_netlocs. An event counts toward the day's reading only if relevance(e) >= 0.30. The day's raw stress reading is the breadth-weighted share of attention spent on stressful news:
                sum over events on day t with relevance(e) >= 0.30 of relevance(e) * breadth(e)
intensity(t) = -------------------------------------------------------------------------------------
                              sum over all events on day t of breadth(e)
Two choices matter. Breadth is the weight, so a story carried by 200 outlets counts once, weighted by 200, not as 200 events. And the reading is a share, not a count, so it does not drift up as the corpus grows: a count rises on crawl volume alone, a share of attention does not.
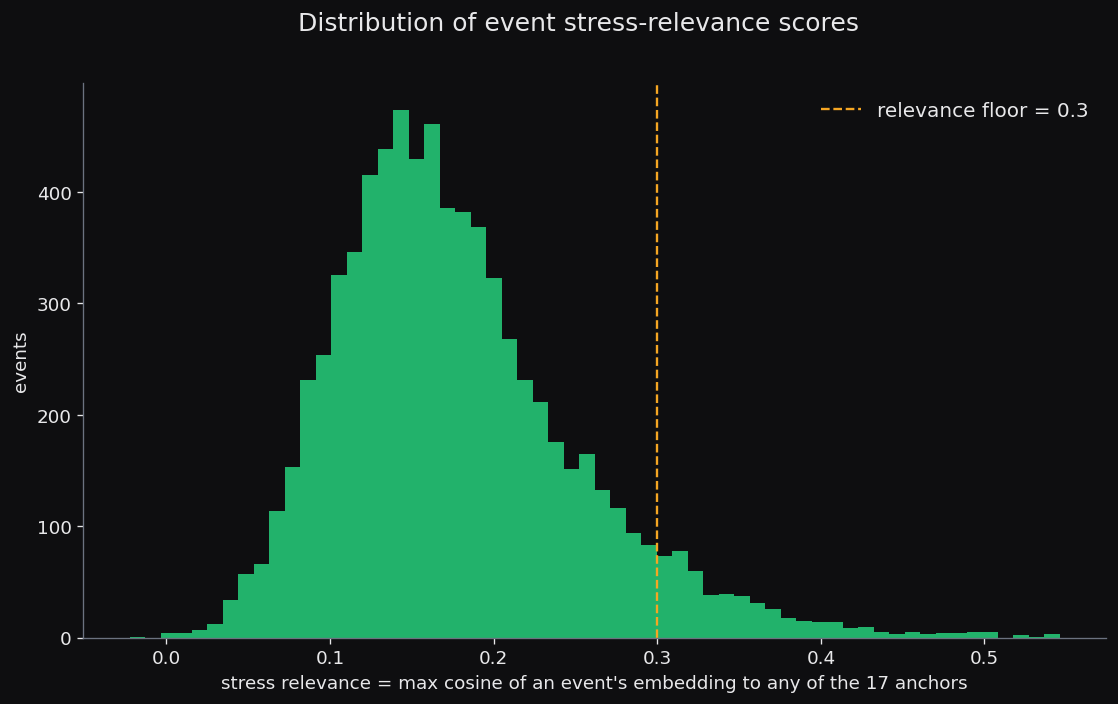 Histogram of stress-relevance scores for real news events: the x-axis is each event's maximum cosine similarity to the 17 stress anchors, the green bars pile up near zero, and an amber dashed line marks the 0.30 relevance floor above which an event counts toward the daily reading
Relevance scores pile up near zero: most news is not about market stress. Only events past the 0.30 floor count. Two real headlines that clear it:
| Stress relevance | Nearest anchor | Real headline |
|---|---|---|
| 0.57 | tariffs | Trump Tariff Threats on Greenland Spark Global Trade War Fears |
| 0.45 | employment_shock | US Jobless Claims Rise Marginally While Q3 Productivity Surges |
Calibration: from a raw share to a causal score
The raw share is not directly tradeable: its level is not comparable across years, and it is noisy. We turn it into a unitless, strictly-trailing z-score in three causal steps, none of which use future data:
1. s(t) = 7-day trailing mean of intensity(t)              (settle daily noise)
2. z(t) = (s(t) - median) / (1.4826 * MAD)                 (median and MAD over the
                                                            trailing 252 trading days;
                                                            1.4826 puts it in sigma units)
3. z(t) = EWMA(z, span = 7)                                (so the position does not flicker)
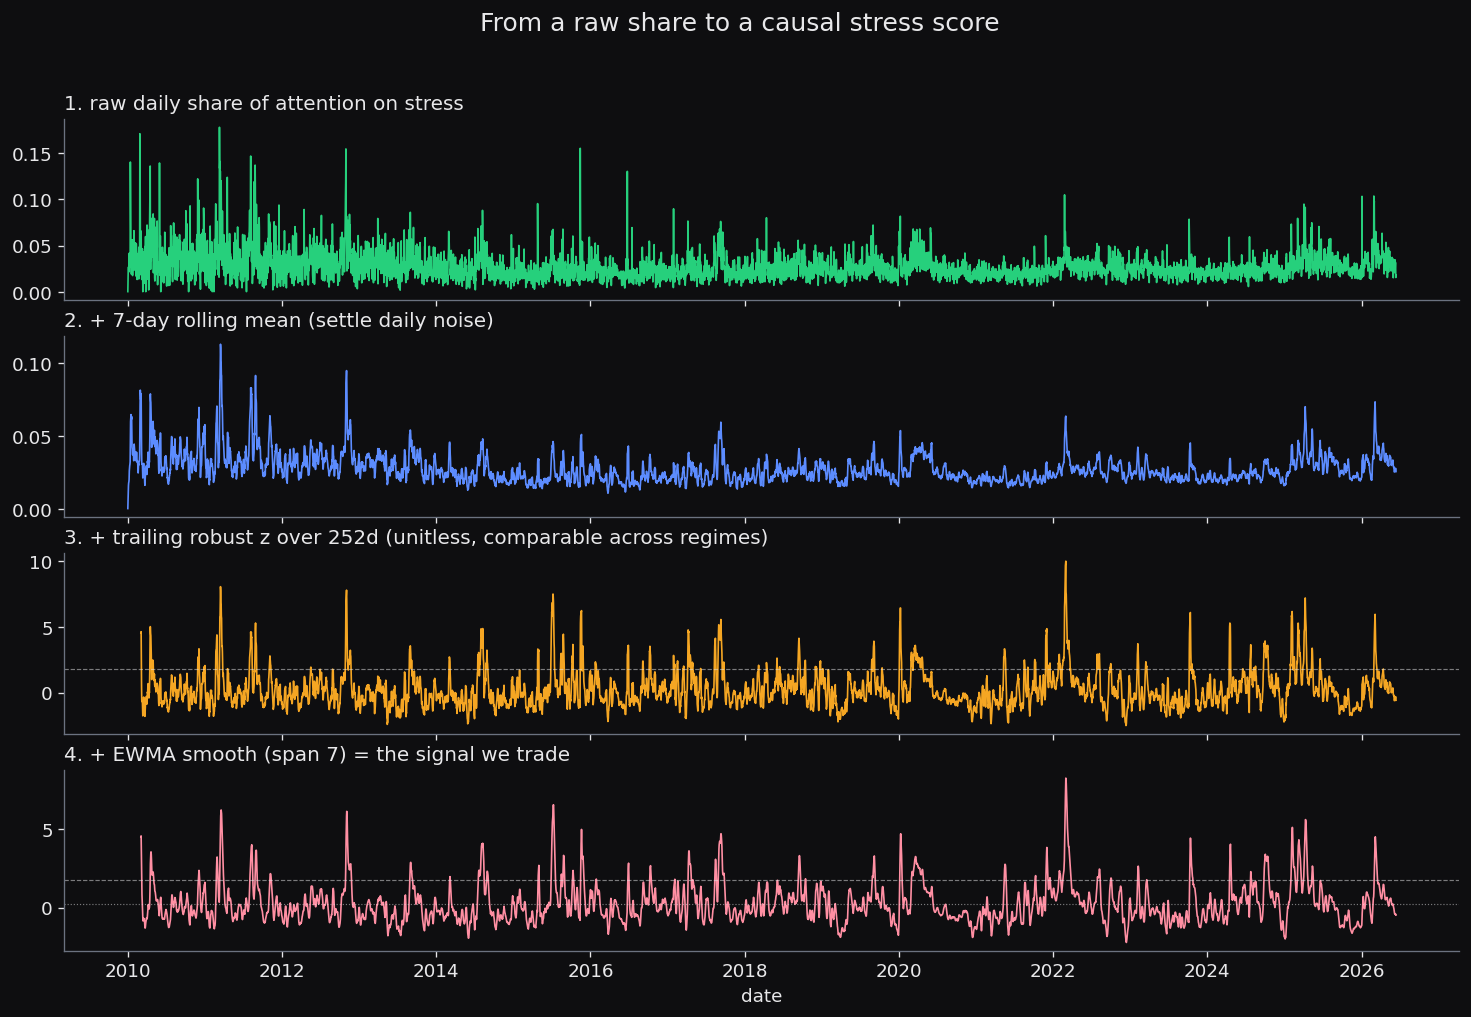 The calibration pipeline in four stacked panels, top to bottom: the raw daily attention share, a 7-day rolling mean, the trailing 252-day robust z-score, and the EWMA-smoothed z that is actually traded, with the de-risk threshold drawn on the lower panels
Top to bottom, the noisy raw share becomes a smoother, unitless score that spikes in 2020 and 2022 and is quiet between. The robust z rescales by the trailing window, so a reading of "2" means the same thing in a calm year and a volatile one.
The rule
A two-state machine on the calibrated z. The signal is lagged two trading days before it can trigger, and positions execute on the next bar, so every trade uses information knowable before it is placed:
state = LONG (fully in equities)
  if state == LONG and z > 1.75:          -> OUT (move to BIL.US), days_out = 0
  if state == OUT:
      days_out += 1
      if days_out >= 5 and z < 0.25:      -> LONG
cost = 1 bp charged on |w(t) - w(t-1)| each time the position changes
When out, the defensive leg is BIL.US (SPDR 1-3 Month T-Bill ETF): the strategy earns the equity return when long and the T-bill return when out. That is the whole rule. The thresholds (exit 1.75, enter 0.25, min hold 5) were not hand-picked; the next section shows how they were selected and frozen.
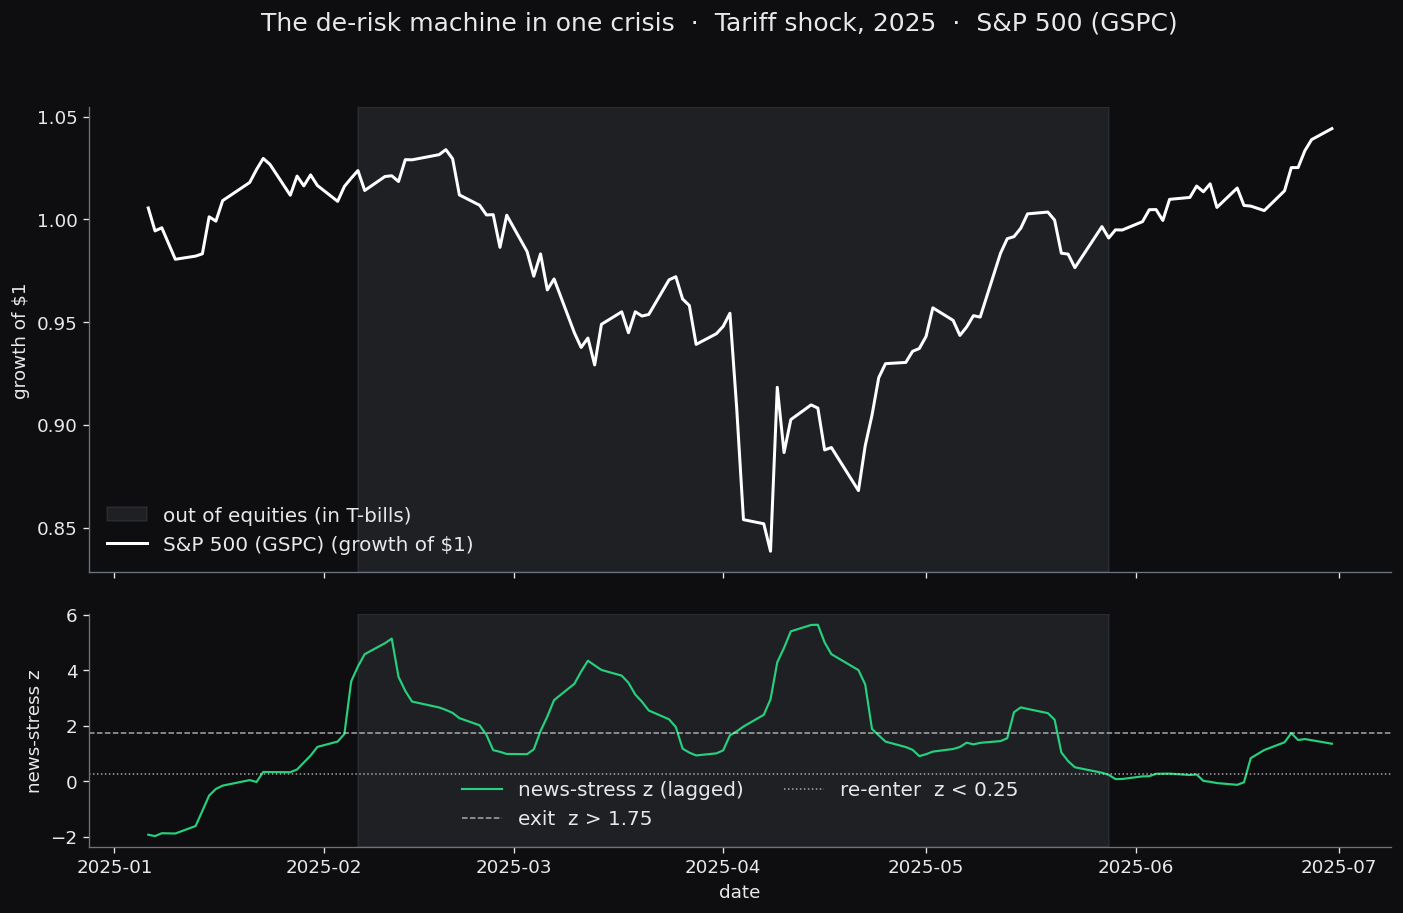 The 2025 tariff shock in two stacked panels: on top the S&P 500 growth of $1 with the out-of-equities window shaded red, and below the lagged news-stress z crossing the exit line (z greater than 1.75, dashed) in February and falling back under the re-enter line (z less than 0.25, dotted) in late May
The 2025 tariff shock is one episode of the frozen rule on recent data. The stress z crossed the exit line in early February, the overlay moved to T-bills (shaded), sat out the roughly 19% peak-to-trough drop to the April low, and re-entered in late May once the z fell back under the re-enter line. It gave up part of the rebound. That is the cost.
How the thresholds were chosen
The rule is selected on a 2010 to 2013 training window, separated from the test window by a one-year (252 trading day) embargo so no test-period calibration window overlaps training data, then frozen. Every result below is on the untouched 2015-01-02 to 2026-06-01 test period, which selection never saw.
On the train window only, we sweep a small grid and pick the cell that most improves the Sortino ratio over buy-and-hold (improvement over buy-and-hold, not the raw level, so the choice rewards timing rather than equity exposure):
exit_z   in {1.75, 2.0, 2.25, 2.5, 2.75, 3.0}
enter_z  in {0.0, 0.25, 0.5, 0.75}
min_hold in {3, 5, 10, 15} days
Selection is by plateau, not peak: take the top 20% of cells by train score and set each parameter to the grid value nearest the median of that set. This picks the robust centre of the good region rather than a single in-sample spike. The frozen result is exit 1.75 / enter 0.25 / hold 5, with the news lagged 2 days, BIL.US as the defensive leg, and 1 bp per unit of turnover.
A sanity check against the VIX
Before any backtest: does a text-only stress reading line up with a market-based stress gauge at all? We plot the calibrated z against the VIX as a check that the signal is measuring market stress rather than noise. The VIX is not part of the strategy.
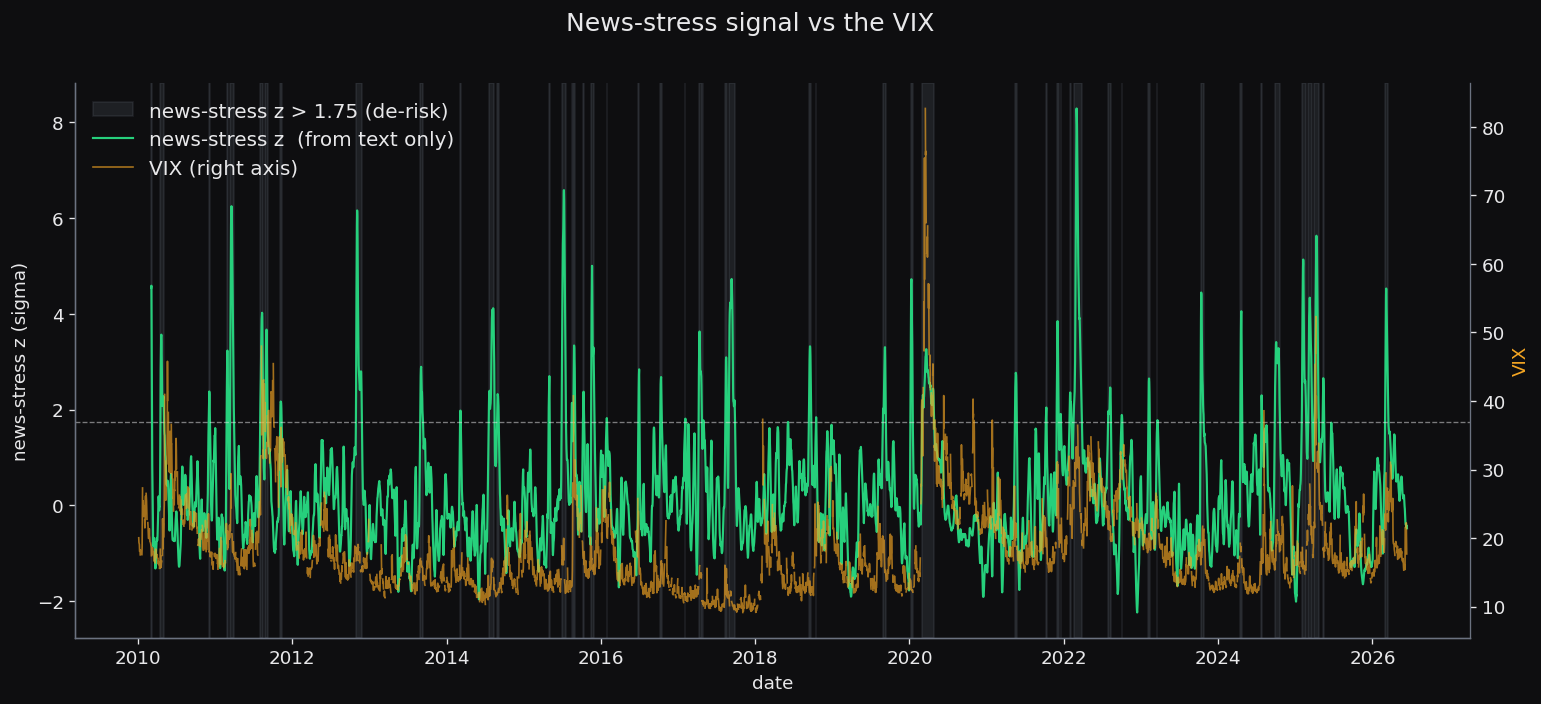 The calibrated news-stress z (green, left axis) plotted against the VIX (amber, right axis) from 2010 to 2026, with the periods where the z sits above the de-risk threshold shaded red
The news-stress z (green) and the VIX (amber) rise and fall together through the major episodes (2011, 2015, 2020, 2022), even though the green line is built only from what the news is about and contains no price data. The check passes. Whether it helps a portfolio is the backtest below.
Results: S&P 500
Over the 2015 to 2026 test period the overlay sits out the high-stress windows. It holds buy-and-hold's total return and cuts the maximum drawdown by nearly half, which raises the Sharpe ratio.
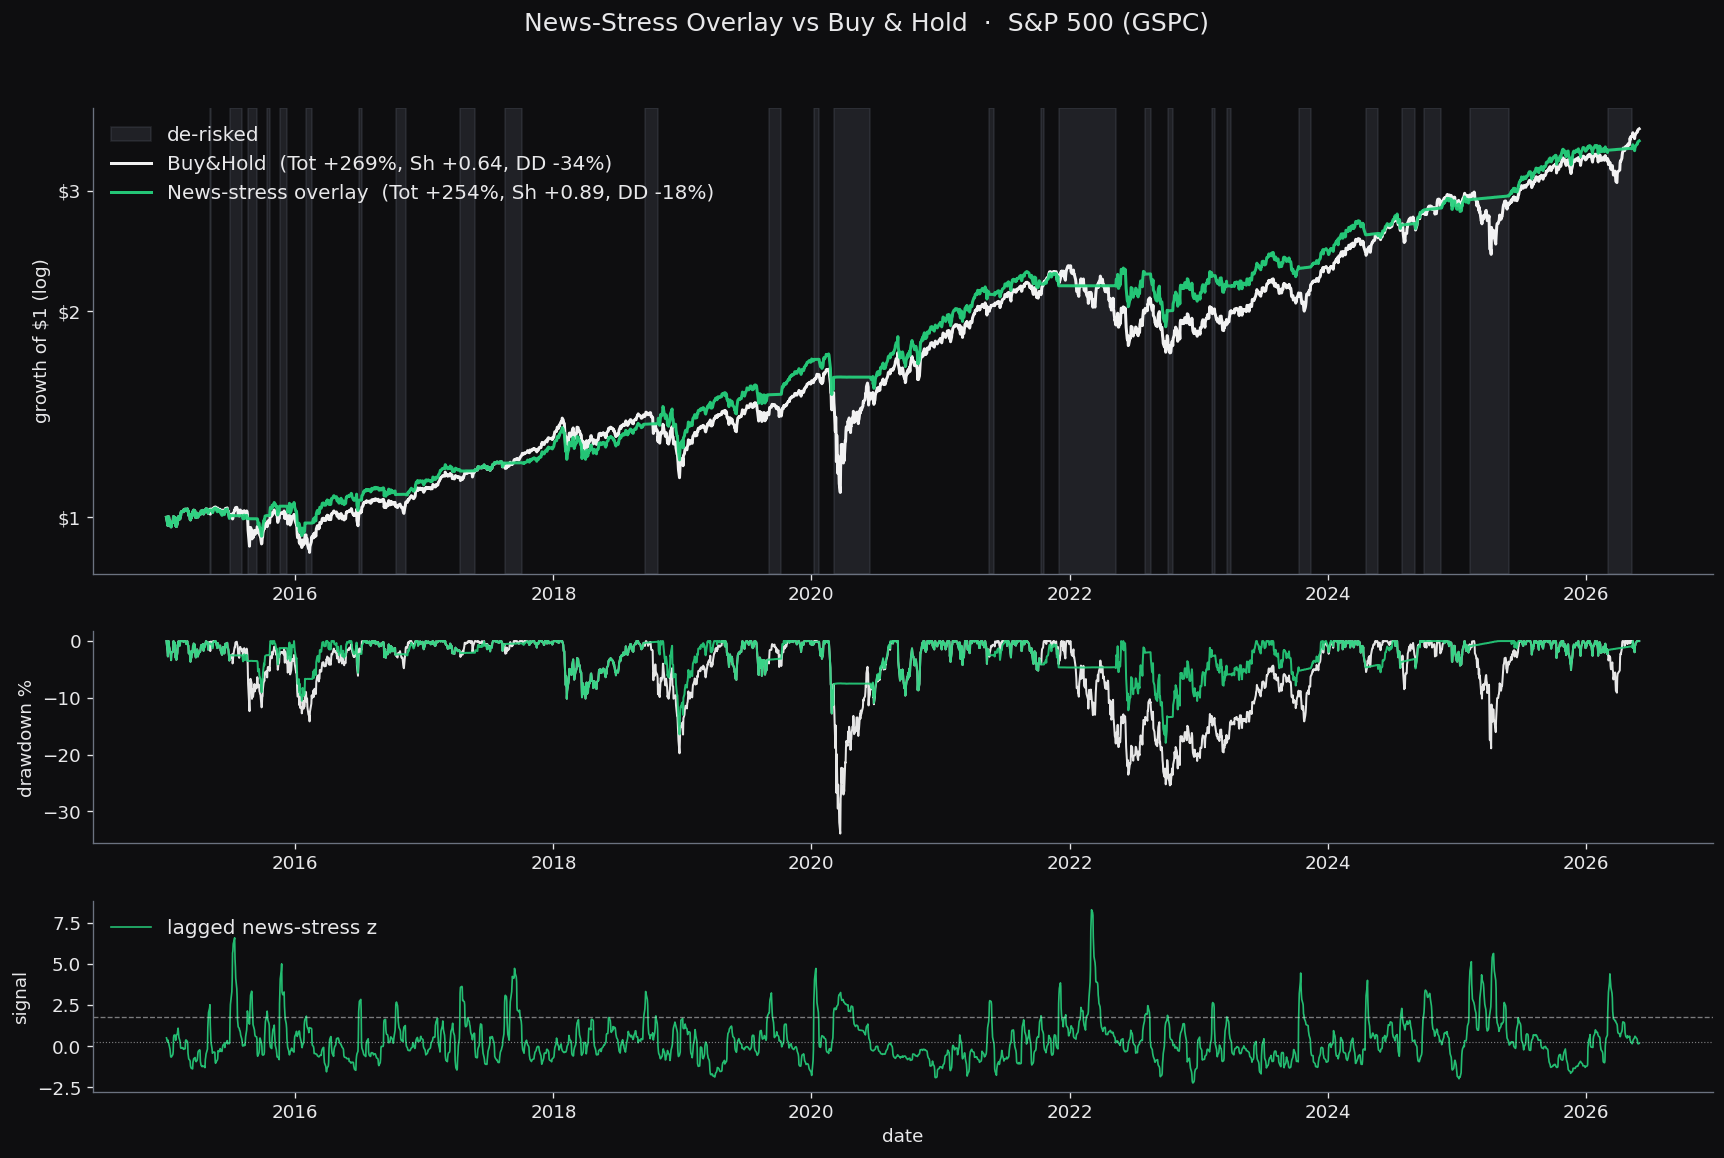 S&P 500 news-stress overlay in three stacked panels, 2015 to 2026: log growth of $1 for buy-and-hold (white) versus the overlay (green), the drawdown path of each, and the lagged news-stress z with its exit and re-enter thresholds; red shading marks the days the overlay spent out of equities
| Strategy | Sharpe | Sortino | Total return | Max drawdown |
|---|---|---|---|---|
| Buy & Hold | +0.64 | +0.77 | +269% | −34% |
| News-stress overlay | +0.89 | +1.01 | +254% | −18% |
The overlay is out of equities about a quarter of the time, across 27 short episodes, with turnover under five round-trips a year. It is cheap to run and low-turnover. Same return, roughly half the drawdown.
It transfers: Nasdaq and Russell 2000
The test of a news-based risk signal is whether it reads something about equity risk broadly or just one index. We take the rule frozen on the S&P 500 and apply it, unchanged, to two other markets. The signal is identical across all three; only the equity leg changes.
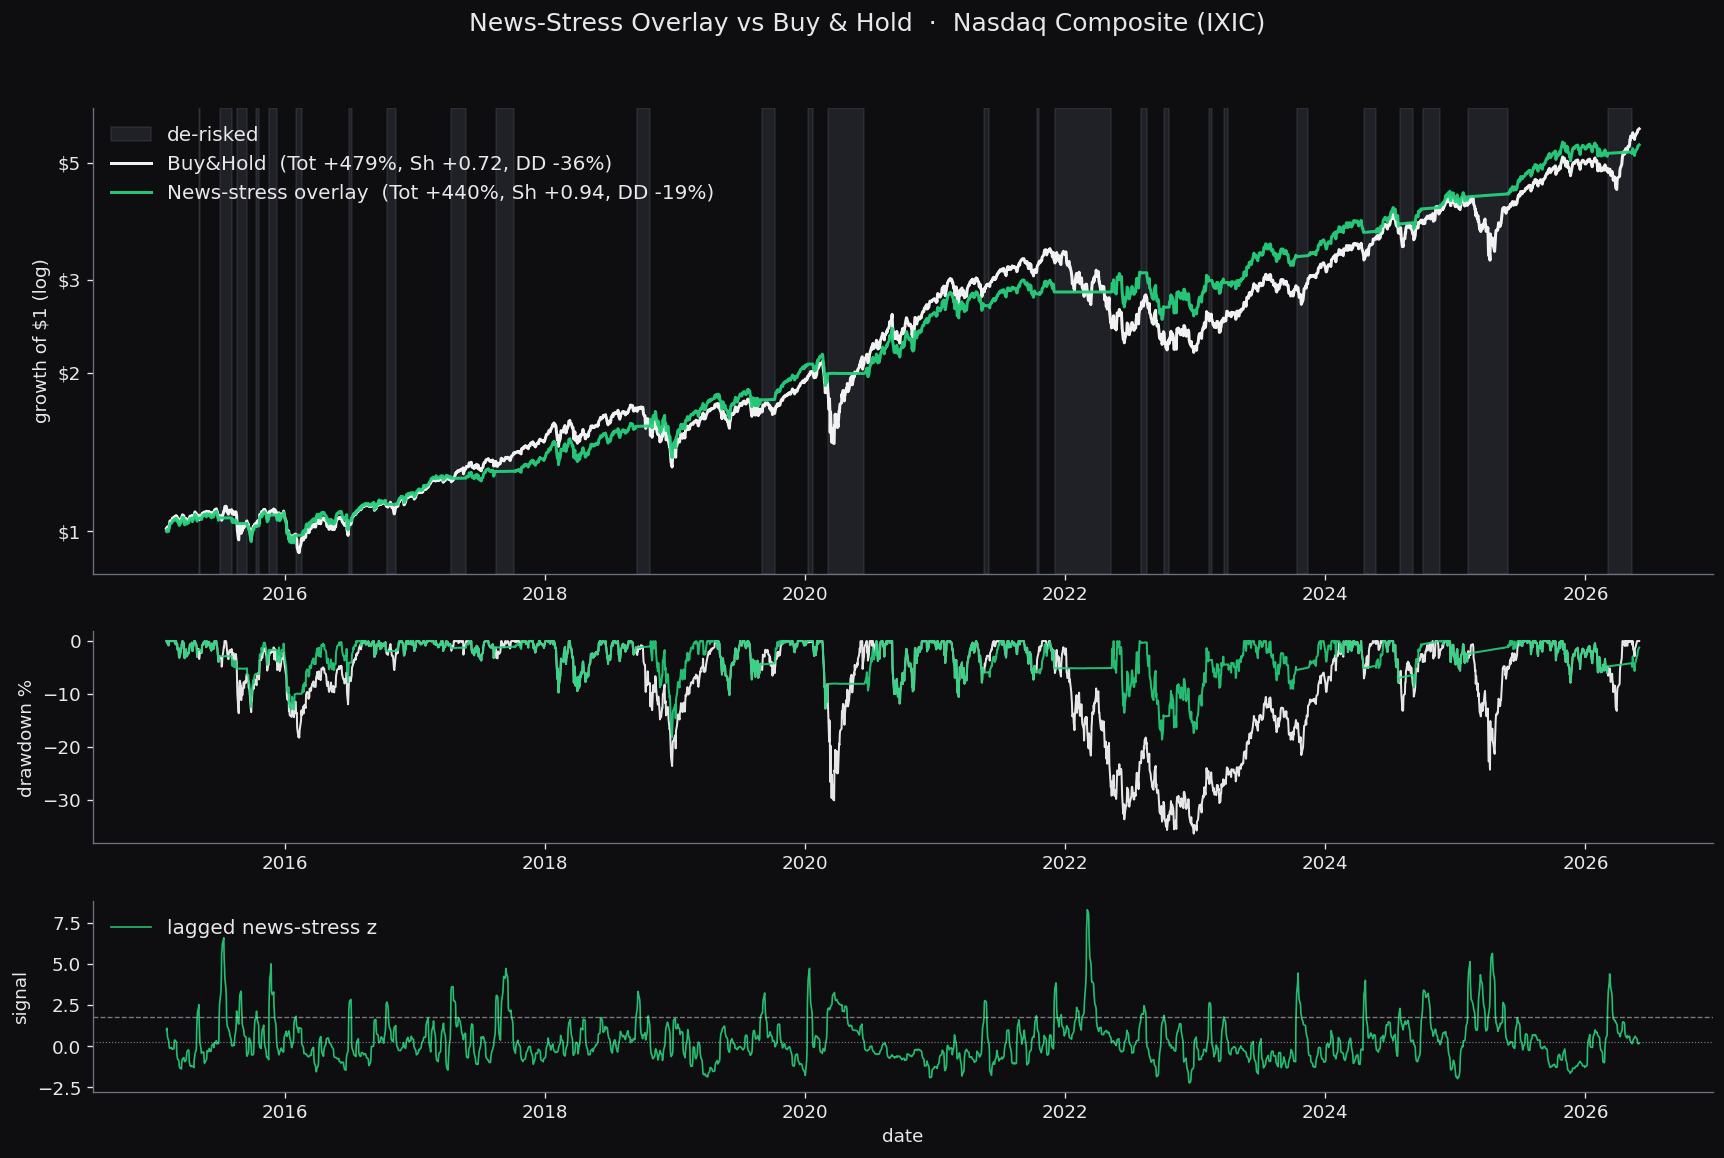 Nasdaq Composite news-stress overlay versus buy-and-hold, 2015 to 2026: log growth of $1 (overlay in green, buy-and-hold in white), the drawdown of each, and the lagged news-stress signal, with the days out of equities shaded red
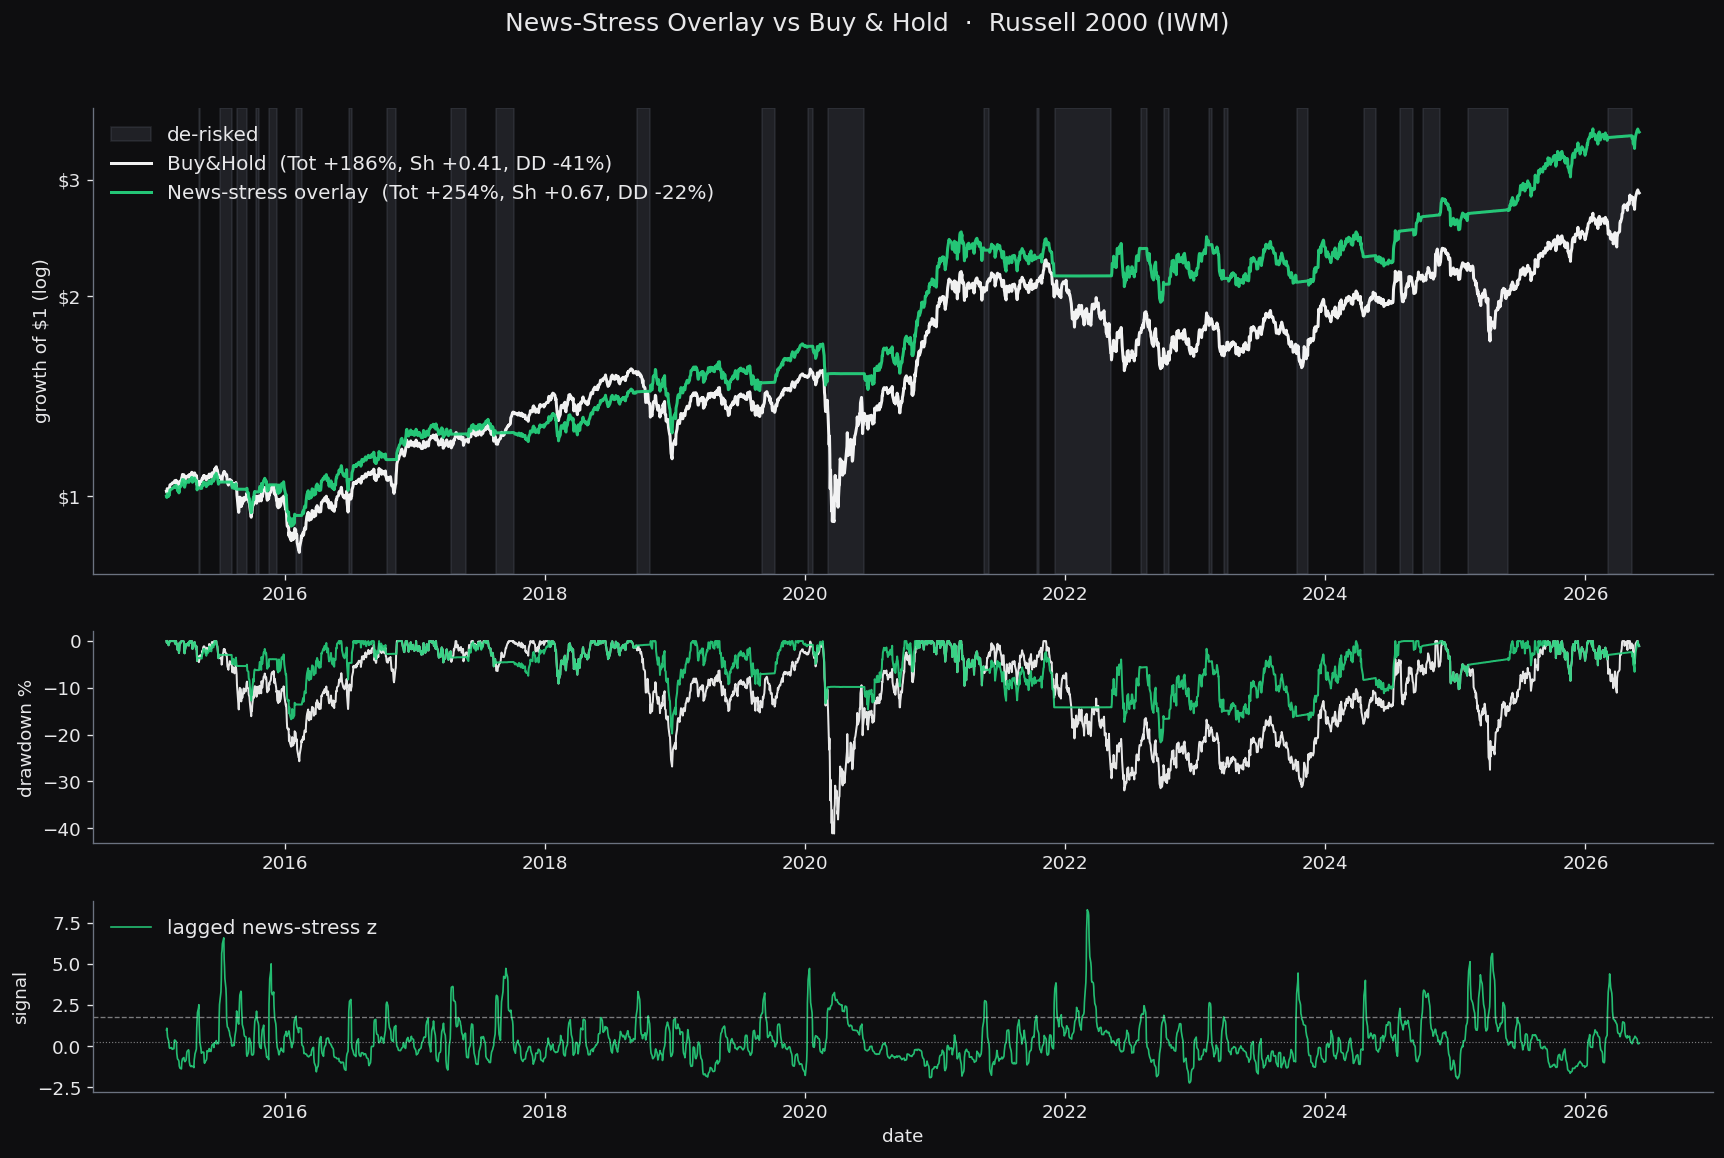 Russell 2000 (IWM) news-stress overlay versus buy-and-hold, 2015 to 2026: log growth of $1 (overlay in green, buy-and-hold in white), the drawdown of each, and the lagged news-stress signal, with the days out of equities shaded red
| Market | Sharpe (B&H → overlay) | Max drawdown (B&H → overlay) | Total return (B&H → overlay) |
|---|---|---|---|
| S&P 500 (GSPC) | +0.64 → +0.89 | −34% → −18% | +269% → +254% |
| Nasdaq Composite (IXIC) | +0.72 → +0.94 | −36% → −19% | +479% → +440% |
| Russell 2000 (IWM) | +0.41 → +0.67 | −41% → −22% | +186% → +254% |
The Nasdaq matches the S&P result: near-flat total return, drawdown almost halved. The Russell 2000 is the stronger case: small caps fall harder in the flagged windows, so sitting them out cut the drawdown from −41% to −22% and raised total return from +186% to +254%. In all three markets the cut shows up in both halves of the test period, not just one, which is the opposite of what an overfit rule decaying out-of-sample would do.
Honest accounting
It reduces drawdown. It will not beat a strong bull market, and a sell-off that recovers costs return; that cost shows up in individual episodes.
The test is honest by construction. The signal is strictly trailing, the news is lagged two trading days, and trades execute on the next bar. The rule was selected only on 2010 to 2013, frozen behind a one-year embargo, and measured solely on the untouched 2015 to 2026 window.
One method, many signals
The recipe generalises: define what you care about as a handful of phrases, score the world's already-embedded news against them, weight by how broadly each event was covered, and calibrate to a causal score. Point the same machinery at different anchors and you get a geopolitical-risk reading (which we have matched against the Federal Reserve benchmark), commodity-supply stress, or a sector- or single-name news-pressure signal as an input to your own models. Each runs over the same database, across every language, with no language model reading each article.
Data and how to reproduce it
Everything here is rebuildable from two sources:
- NOSIBLE event database for the signal. Per de-duplicated event we use the stored embedding (
oai_vector, OpenAItext-embedding-3-large), publisher breadth (total_netlocs), and event date, over the full daily history. Embed the 17 anchors above with the same model, truncate both the event vectors and the anchors to the first 1024 dimensions of the 3,072-dimensional Matryoshka embedding and L2-normalise, then computeintensity(t)and calibrate as specified. - EODHD end-of-day adjusted close for prices and the defensive leg:
GSPC.INDX(S&P 500),IXIC.INDX(Nasdaq Composite),IWM.US(iShares Russell 2000),BIL.US(SPDR 1-3 Month T-Bill ETF), andVIX.INDXfor the sanity-check figure. Returns are daily log returns; the overlay earns the equity leg when long and the T-bill leg when out, with 1 bp charged per unit of turnover.
The full parameter set is fixed: relevance floor 0.30, rolling-mean window 7, robust-z window 252, EWMA span 7, news lag 2 trading days, exit z 1.75, enter z 0.25, min hold 5 days, 1 bp/turn, defensive leg BIL.US.
Work with Nosible
NOSIBLE turns the world's news into a structured, multilingual, de-duplicated event database, and this post used one slice of it. If you want access to that database, or a signal like this built for your own models, start a trial. You can explore the live data at nosible.world.
Point-in-Time Knowledge Graphs over Named Entities with NOSIBLE World
Two Tricks for Turning Sentence Embeddings into Clean Features