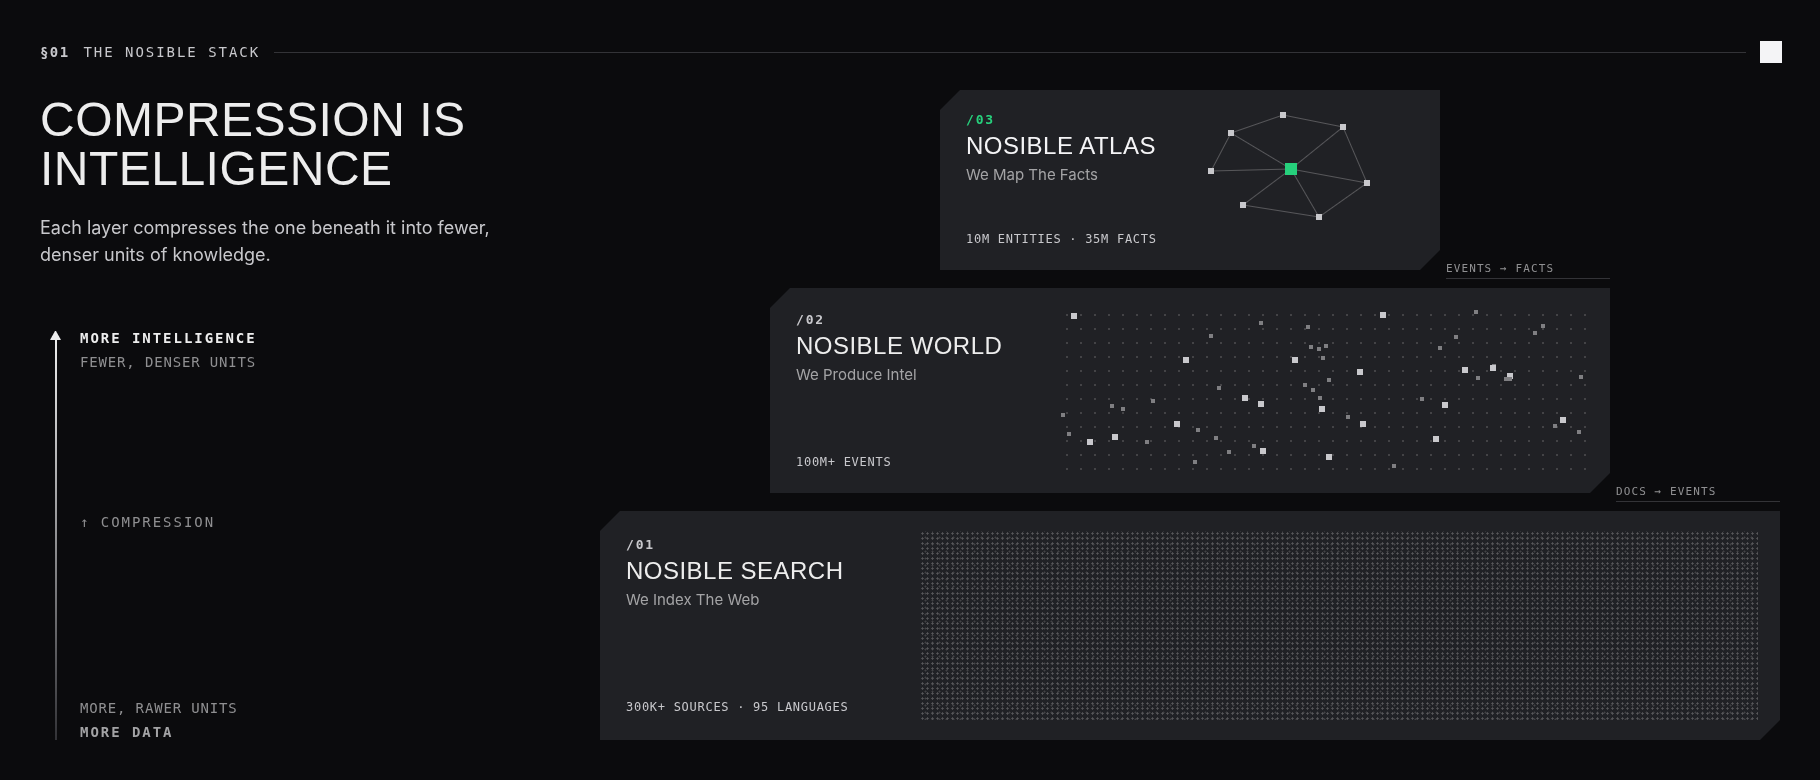
NOSIBLE is on a mission to know everything, all the time. To do that we're building the NOSIBLE intel stack. It comprises Firehose, Search, World, Atlas, and Risks. Each level of the stack offers a different capability:
Product
Capability
Firehose
A low latency feed of maximally enriched content published to the worldwide web for continuous monitoring, research, analysis, and automated workflows.
Search
A search engine built to find high-quality, relevant, dated content published to the web, helping teams discover evidence and investigate emerging developments.
World
A backtest-friendly database of world events with vectors, entities, and ontologies for systematic research and building data-driven investment strategies.
Atlas
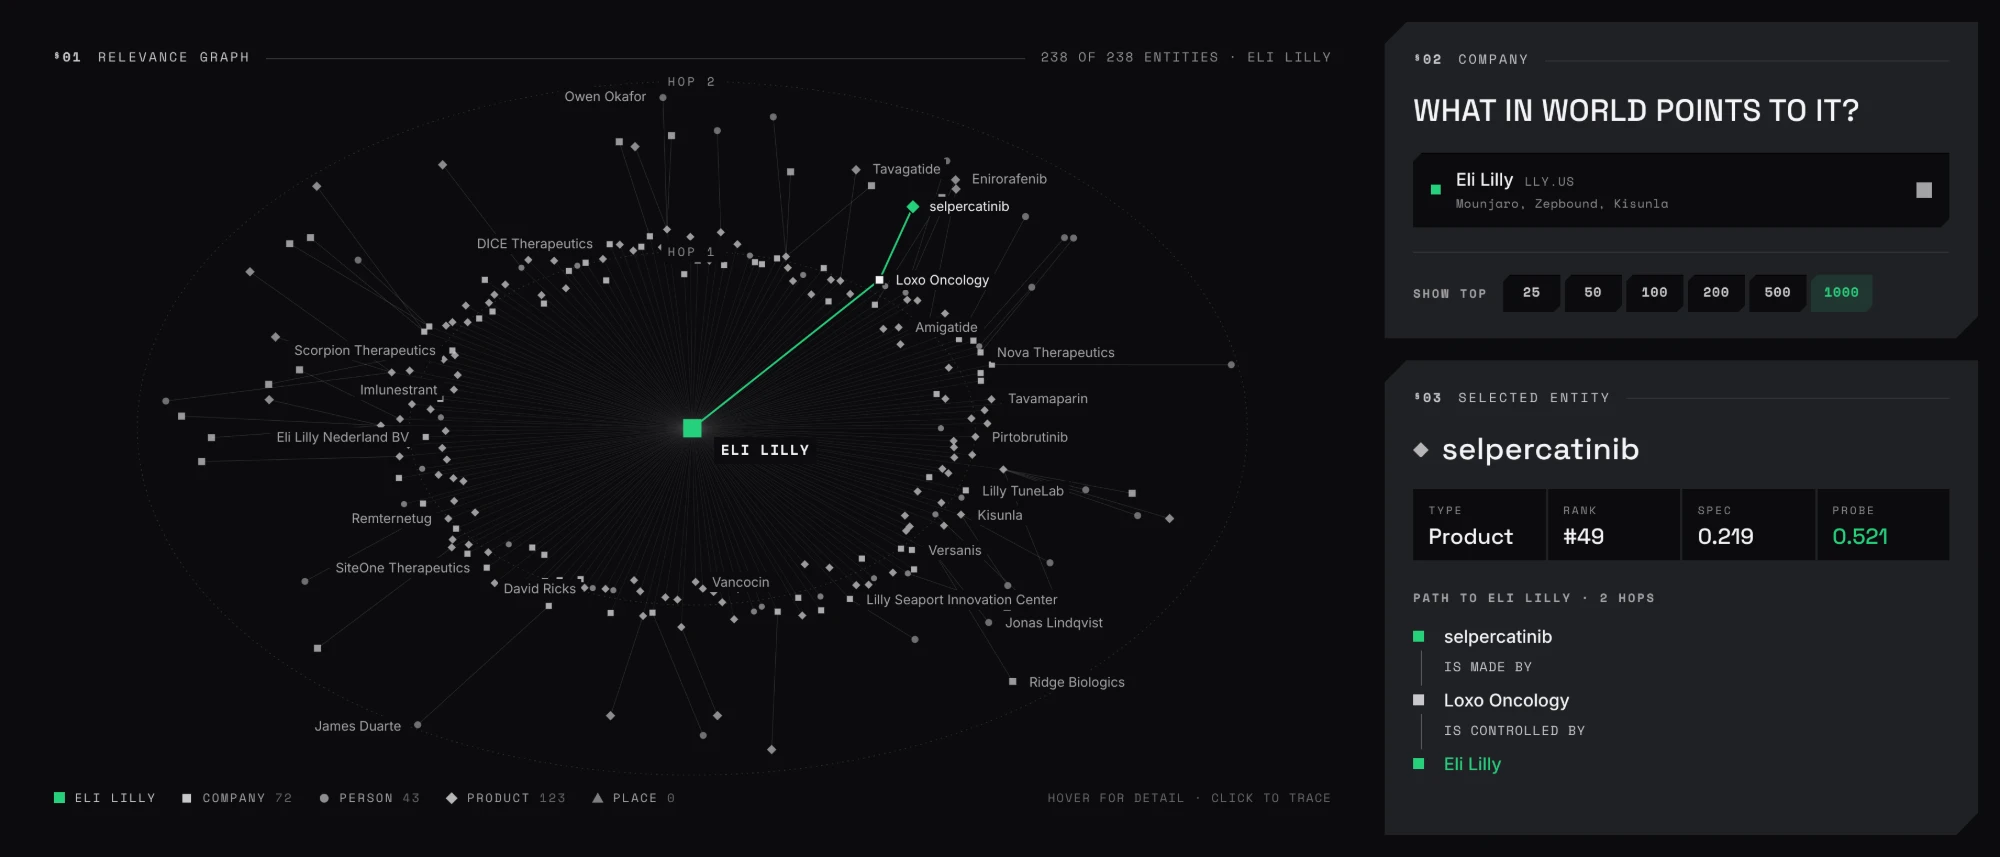
A point-in-time knowledge graph spanning over 7 million entities and 35 million facts, connecting companies, people, products, and places through evidence.
Risks
A quantitative risk engine built to turn situational awareness into priced, directional bets, supporting research, portfolio construction, and informed trading decisions.
Another way to think of intelligence is through the lens of modalities. What modalities do we care about? We want to know, in real time, what happened, when, to whom, where it happened, and why it happened.
We're pretty good at what, when, and who right now. We're not good at where and why. So while building V2.0-preview we invested a lot more time into "where". Given some natural language, how do we translate that into a list of locations including continents, regions, countries, cities, latitudes, and longitudes?
In this blog post we're sharing two things. First, we're sharing a new endpoint that lets you query events by polygon. Second, we'll demonstrate how Atlas can be used to geocode text. We'll use the geography of the oil trade to connect the two.
Querying events by polygon
We monitor five oil transit chokepoints identified by the US Energy Information Administration: the Strait of Hormuz, the Strait of Malacca, the Suez Canal, the Danish Straits, and Bab el-Mandeb. These areas cross national borders.
These waterways span several countries. Country filters include large areas outside them, adding results that need further review. Drawing polygons around the straits, canals, and their approaches lets us focus the search on relevant areas.
The World V2.0-preview polygon endpoint accepts GeoJSON, a format for geographic boundaries. Use a Polygon for one area or a MultiPolygon for several. An event matches when any stored location falls inside.
This example uses seven polygons: one each for Hormuz, Malacca and its Singapore approaches, Suez, and Bab el-Mandeb, plus three for the Danish Straits. Those three cover Little Belt, Great Belt, and Øresund. We submit them as a MultiPolygon.
View all seven polygon histories OCT 2025–SEP 2026 +
Monthly matching events
October 2025–September 2026. Select a bar to change the month and map.
Strait of Hormuz
1,369September 2026
Scale: 0–3,486 events
Oct 25Jan 26AprJulSep 26
Malacca and Singapore approaches
3,340September 2026
Scale: 0–3,340 events
Oct 25Jan 26AprJulSep 26
Suez Canal
88September 2026
Scale: 0–187 events
Oct 25Jan 26AprJulSep 26
Little Belt
13September 2026
Scale: 0–44 events
Oct 25Jan 26AprJulSep 26
Great Belt
10September 2026
Scale: 0–22 events
Oct 25Jan 26AprJulSep 26
Øresund
325September 2026
Scale: 0–329 events
Oct 25Jan 26AprJulSep 26
Bab el-Mandeb
143September 2026
Scale: 0–143 events
Oct 25Jan 26AprJulSep 26
Each chart starts at zero and has its own vertical scale. Counts are unique within each polygon and calendar month. An event with locations in several polygons can appear in several charts.
World V2.0-preview archive, queried 16 October 2026. Any stored location can match; all event topics are included. Combined totals deduplicate events across polygons. Illustrative monitoring areas; Natural Earth basemap.
The polygons include a buffer around each waterway because an event's stored coordinates may represent a nearby place, such as a port or city.
We queried each calendar month from October 2025 through September 2026, finding 5,261 unique events across the polygons in September. Use the month control to update the map and counts, and the monthly histories below to compare regional activity. Hormuz rises from 248 matching events in February 2026 to 3,486 in April; Bab el-Mandeb rises from 11 in June to 143 in September.
Charts count each event once per polygon per month, so an event can appear in several charts. The combined total deduplicates across all seven polygons; the Danish Straits total does the same across its three channels. These results include topics beyond oil and shipping. Use the returned descriptions, entities, and classifications to investigate the events that interest you.
Seven polygons in one request
GeoJSON lists coordinates as [longitude, latitude]. A polygon uses a ring of coordinates, repeating the first coordinate at the end to close the boundary. A MultiPolygon combines several polygons into a single geometry.
The date range must fall within your API key's archive access. limit sets the page size, up to 500. If the response includes a next_cursor, send it with the same polygon and filters to retrieve the next page. Download the request body.
Querying monthly totals
For monthly totals, query each month's date range with limit=1 and read total, which counts all matches; count covers only the current page. Our query script makes nine requests per month: seven individual polygons, the combined Danish Straits, and all polygons together. Download the named polygons, counts as CSV, or JSON with query receipts for further analysis.
To build the map, we paged through each month's combined results and checked their coordinates against each polygon, independently reproducing all 84 monthly polygon counts. The marker data and location query script are available too. The default view="lite" returns locations, descriptions, entities, tickers, classifications, and signals; view="full" adds evidence and provenance.
Queries combine archive results with published daily updates within the requested dates. We index stored event coordinates in one-degree cells, scan those intersecting the polygon's bounding box, apply exact point-in-polygon checks, then filter by date and language. Any stored location can match, including places mentioned in an event. A match therefore indicates geographic relevance but doesn't establish an exact incident position.
Geocoding text with Atlas
How do we put events on the map? Large language models (LLMs) classify their geographic context. Atlas connects named entities to places, helping us identify additional locations even when the text does not name those places directly.
When a text names Singapore, we can resolve the name directly. When it names Jurong Port or Tuas Port, Atlas's relationships can help us infer Singapore from the port reference, even when Singapore isn't mentioned.
We used the same statistical technique in our work on ticker mapping, where we inferred listed companies from related entities. For geocoding, we score the relationships between entities and geographic places.
Atlas connects both ports to Singapore through located_in relationships. The September 26 snapshot records evidence for these connections on five and seven distinct days, respectively. Both associations have repeated support.
§03 ATLAS / GEOGRAPHIC ASSOCIATIONS26 SEP 2026
Singapore in the Atlas graph
Select a highlighted entity to inspect its association with Singapore.
22 ENTITIES108 RELATIONSHIPS
Selected walk Stored Atlas relationshipLayout is schematic
SELECTED ATLAS FACT
Jurong Portlocated_in →Singapore
5 distinct evidence days · 08 Feb 2022–01 Jul 2025
SELECTED LOCATION
Jurong Port
SPECIFICITY0.246P(Singapore | Jurong Port)
Mass reaching Singapore when the walk starts at Jurong Port.
COMPARE ENTITIESRELATIVE SCALE
EVIDENCE DAYS
5
RESTART PROBABILITY
0.30
GRAPH SCORE
0.067
Selected relationships supported by evidence dated before 26 September 2026. Scores use the full Atlas graph and measure random-walk mass. Download graph data ↗
We use two-way personalized PageRank to measure these associations: how strongly places connect to entities, and entities to places. An entity can relate to several places. We score its evidence for each place separately.
Measuring geographic prominence
We start from the Atlas records representing a target place, such as a city. A random walk repeatedly follows relationships between connected records. Each step has a 0.30 probability of restarting at the target. Otherwise, relationships with evidence from more distinct days receive more weight when choosing the next step.
If many articles report the same relationship on the same day, that counts as one evidence day. Observing it again on another day adds to its weight.
We measure the share of the walk reaching an entity, written as P(entity | place). This is forward mass. Higher values mean the entity is more prominent in the evidence-weighted relationships connected to the starting place in Atlas.
Measuring geographic specificity
We also need P(place | entity): the mass that would reach the place if we started the walk from the entity. We call this specificity.
Each relationship has equal evidence weights in both directions. This lets us calculate specificity from forward mass:
Strength is the total evidence weight connected to a node. We sum it across records representing the same place. Dividing by the entity's strength accounts for its relationships with other places and entities.
These probabilities describe the random walk. They don't estimate the probability that an event occurred at a location. The reversibility used in this calculation is described by Lofgren, Banerjee, and Goel.
In the Singapore snapshot, Jurong Port's specificity is approximately 0.246, versus Tuas Port's 0.108. Tuas Port has more forward mass, so it's more prominent in the walk from Singapore. Jurong Port has a stronger reverse association with Singapore.
Combining specificity with prominence
To calculate prominence, we divide an entity's forward mass by the tenth-largest forward mass among retained links for that place, capped at one. The graph score is the square root of the product of specificity and prominence, capped at one:
A low score on either measure reduces the combined score. We calculate scores during graph builds, then use the resulting rules to infer locations.
Before inferring a location, we check the supporting relationships, competing locations, where the entity appears in the text, and whether other entities support the same location. Released associations require evidence from at least three distinct days along their supporting paths. We can abstain when the evidence is insufficient.
We resolve place names using aliases, entity types, and administrative context. Graph inference adds candidates from related entities.
Targeted monitoring
World events provide evidence for Atlas. Atlas's geographic associations help locate subsequent events. This connects more named entities to places and makes those locations available to geographic queries. Researchers can use these queries to monitor areas relevant to investments and portfolio exposure.
Geographic queries can help reduce satellite monitoring costs. Planned events provide both an area and a time window to watch. An announced military exercise, port closure, or refinery restart could guide imagery purchases, satellite observation requests, or analysis of existing imagery. Schedule checks before, during, and after the expected activity to focus spending and analyst attention on places where changes could affect your investment decisions.
Reuse the seven polygons for oil chokepoints, or supply GeoJSON boundaries for other areas. Event signals help prioritise where and when to collect or analyse imagery, directing spending and analyst attention towards locations that warrant closer observation before or during planned activity.
S3 delivery, local API, or web API.
Start afree trial
Review the diligence documents, schema, sample data, and delivery options. Then start your trial.