What 350+ Experiments Taught Us About Serving Qwen 3.6 35B-A3B
NOSIBLE World is a web-scale, point-in-time search and event system. It retrieves dated open-web sources and produces structured records with events, entities, and embeddings. World V1 processed hundreds of billions of text tokens. World V2 will cover a longer history, include more events from categories intentionally dampened in V1 to control volume, and process two to three times as much text. That workload makes the cost of Qwen serving a V2 launch constraint.
We chose the open Qwen 35B-A3B model because no model we assessed delivered higher task quality at lower serving cost. Earlier this year, we benchmarked it against Gemini Flash and DeepSeek for creating NOSIBLE World. Qwen matched or exceeded both on that workload. The benchmark selected the Qwen model family; this campaign selected its serving configuration. We hope Qwen releases a 3.8 35B-A3B variant soon because it would be the first model we test with this serving method for World V2.
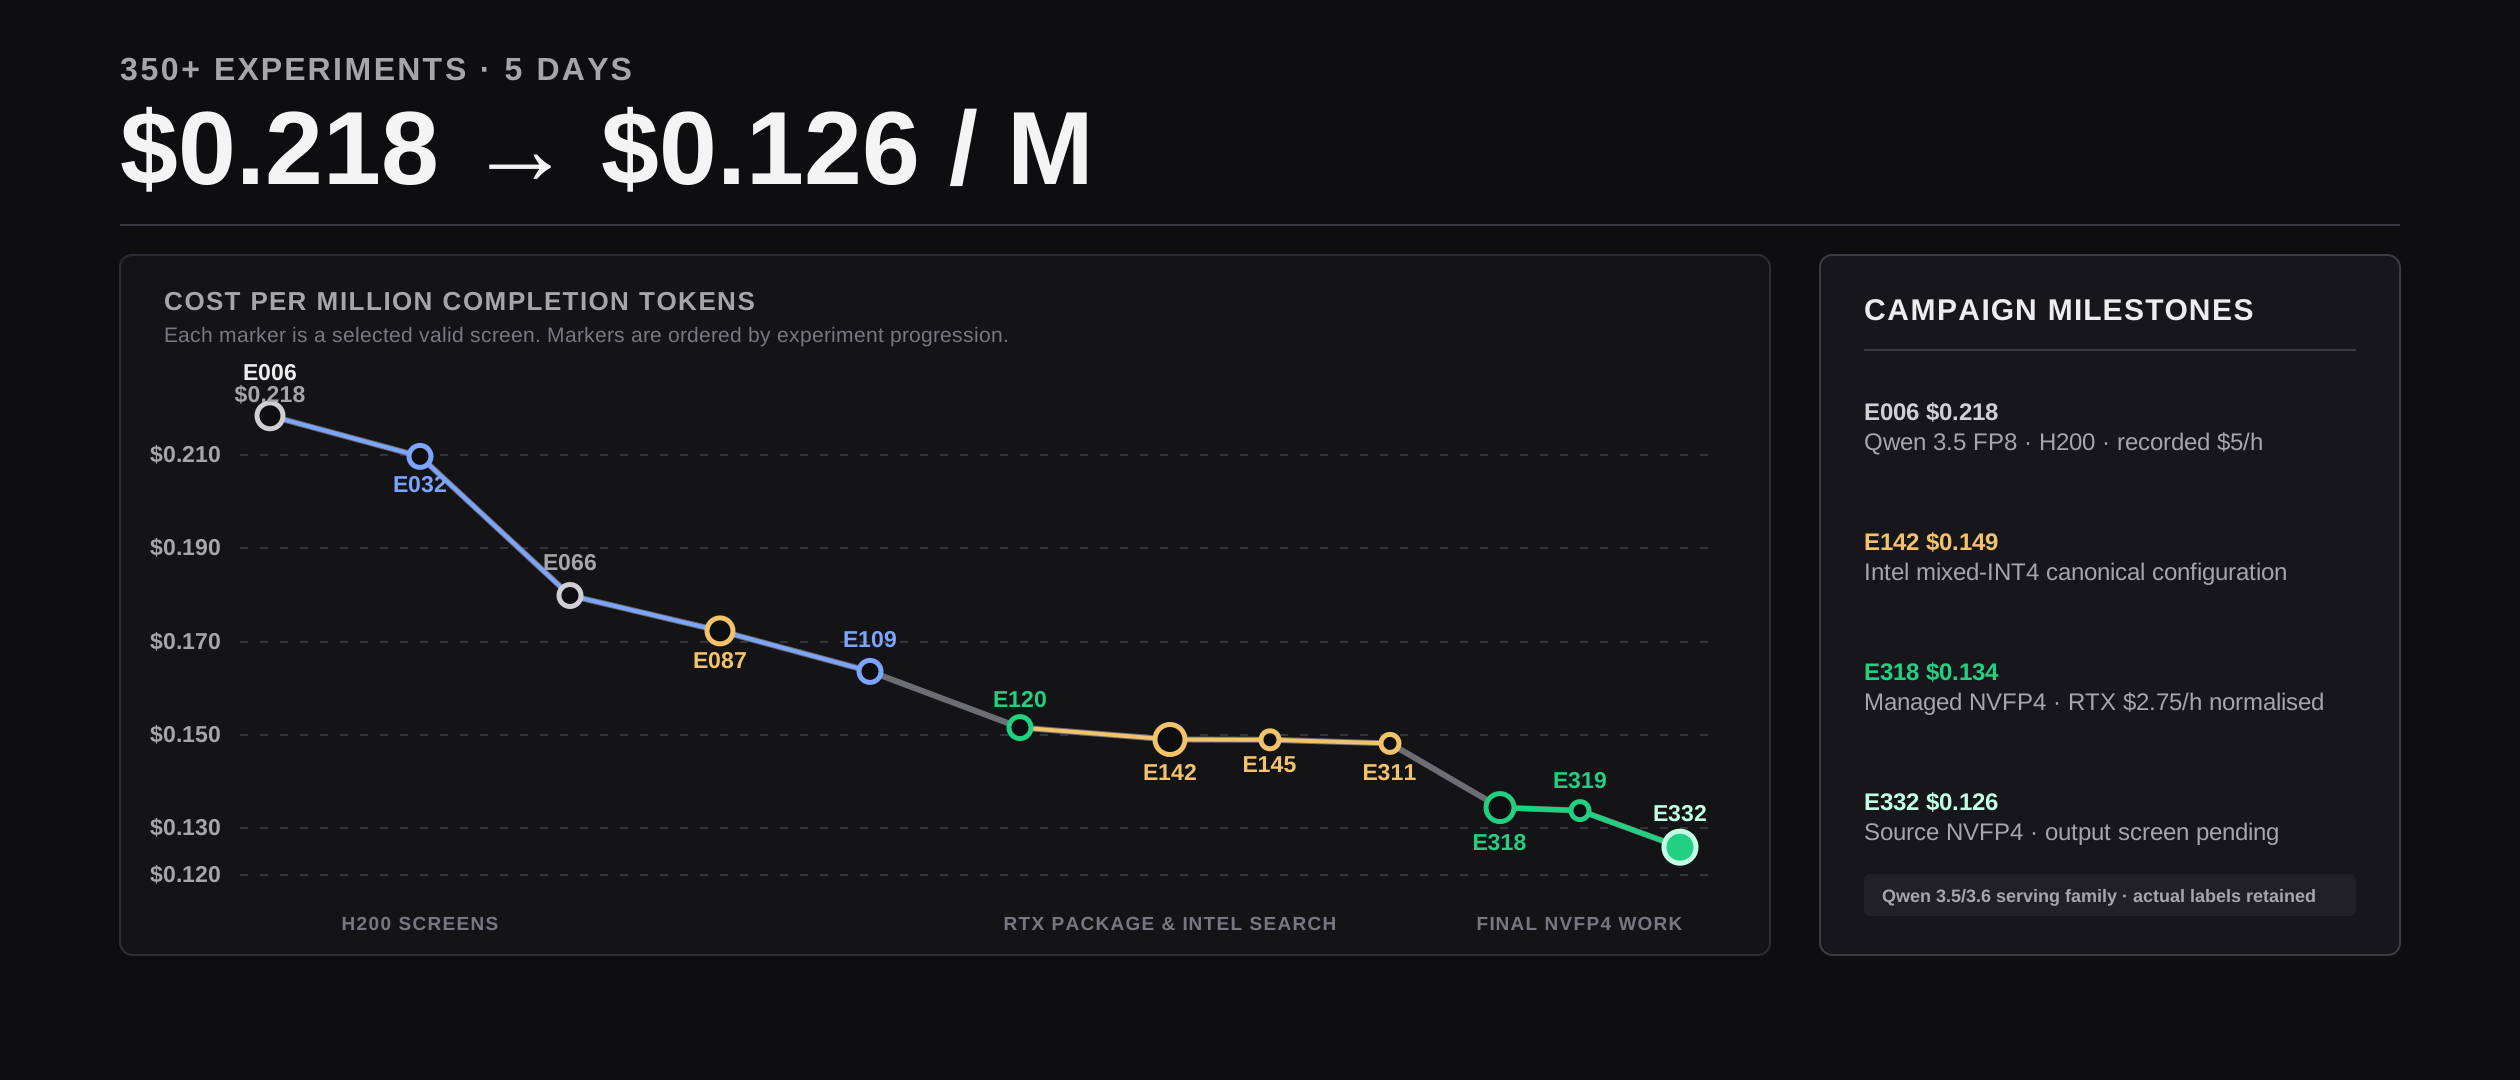
Five days and more than 350 serving experiments reduced the steady-state cost of the Qwen 35B-A3B serving branch used to build World from $0.218400/M to $0.125959/M. The final branch generated 6,064.60 completion tokens per second on one RTX PRO 6000 Blackwell, using a $2.75-per-hour GPU-cost normalisation. The campaign covered Qwen 3.5 and Qwen 3.6, and every result retains its actual model label.
1. Checkpoint packages and quantisation
Qwen 3.6 35B-A3B is a mixture-of-experts model with 35 billion total parameters and roughly three billion active parameters per generated token. The checkpoint's routed-expert layout and the kernel that executes it therefore affect serving cost.
We screened weight packages on H200 and RTX PRO 6000 to choose branches for deeper work. The results below use their recorded serving conditions and do not rank every checkpoint for every workload.
| Checkpoint family | Representative result | What it told us |
|---|---|---|
| Intel mixed-INT4 AutoRound | 5,126.77 tok/s; $0.149000/M | The initial production benchmark to beat. |
| Unsloth NVFP4 Fast | 5,040.22 tok/s; $0.151559/M | Four-bit floating point did not win without tuning. |
| Red Hat AI NVFP4 | 4,979.54 tok/s; $0.153405/M | A valid alternative, but not the first priority. |
| Red Hat AI dynamic FP8 | 7,019.22 tok/s; $0.197870/M on H200 | Valid H200 package screen; it did not advance. |
| QuantTrio AWQ | 4,957.00 tok/s; $0.154103/M | Usable, but behind the early leaders. |
| RDTand PrismaQuant | 4,616.41 tok/s; $0.165473/M | Did not justify more work in this campaign. |
| 88plug W4A16 | 4,435.00 tok/s; $0.172241/M | Lower precision alone did not overcome the serving cost. |
NVFP4 uses four-bit floating-point weights. W4A16 uses four-bit weights and 16-bit activations. Those labels omit the execution library, routed-expert layout, auxiliary modules, and available memory that determined these results.
A weight-format label does not predict serving cost. On H200, NVIDIA's ModelOpt NVFP4 Qwen checkpoint reached 6,623.18 completion tokens per second at $0.209701/M; the same path on RTX PRO 6000 reached 2,563.40 tokens per second at $0.297998/M. On the RTX PRO 6000 run, the Marlin path reported no native FP4 compute and used weight-only FP4 compression. Reducing native MTP depth from three proposals to one on H200 improved the package to 7,022.95 tokens per second and $0.197764/M. The FlashInfer TensorRT-LLM mixture-of-experts alternative failed at engine startup on the deployed Blackwell configuration.
Intel's mixed-INT4 AutoRound was the benchmark
Intel's Qwen3.6-35B-A3B-int4-mixed-AutoRound checkpoint kept 243 precision-sensitive modules in FP16 and quantised routed experts to four-bit weights. It loaded, completed the offered client load, and executed on Marlin. It set the Qwen 3.6 cost benchmark during the checkpoint search.
| Change from the early Intel configuration | Result | Decision |
|---|---|---|
| Reduce resident sequences from 1,280 to 512 | $0.149726/M | Better scheduling geometry |
| Reduce batch capacity from 24,576 to 16,384 tokens | $0.149179/M | Better prefill/decode balance |
| Use the CUDA 12.9 vLLM build | $0.149000/M | Canonical Intel configuration |
| Force the Marlin mixture-of-experts backend | $0.148947/M | 0.036% numerical edge; not adopted |
Resident sequences count requests scheduled on the GPU; they exclude clients waiting for work. The explicit-Marlin A/B measured 5,128.61 tokens per second and $0.148947/M, 0.036% below the automatic CUDA 12.9 control. It missed the 0.75% adoption threshold.
Later Intel sweeps produced lower isolated values, including $0.148162/M, but did not replace the replicated automatic control. Experiment 142 remained the canonical Intel configuration. AutoRound documents the quantisation method; the checkpoint card lists the retained modules.
Intel's mixed-INT2 branch required a runtime repair because Qwen's auxiliary predictor contains BF16 tensors while routed experts use the low-bit Humming path. After that repair, two full passes reached 5,218.81 tokens per second and $0.146372/M. The branch did not become the final economic leader. Screen a quantised checkpoint as a package: retained precision, kernel path, auxiliary-module compatibility, and sustained-load behaviour determine the result alongside bit width.
2. Hardware cost
The campaign began on H200 and later screened RTX PRO 6000 Blackwell. Experiment 006 is the Qwen 3.5 campaign starting point. It is outside the Qwen 3.6 GPU comparison. H200 produced more raw completion tokens per second in these records, while RTX PRO 6000 produced the lower cost per completion token.
| Representative branch | GPU | Completion tok/s | Cost basis used in the record | Decision |
|---|---|---|---|---|
| Qwen 3.5 FP8, Experiment 006 | H200 | 6,359.80 | $0.218400/M at recorded $5/h | Historical campaign starting point |
| Qwen 3.6 Intel mixed-INT4, Experiment 087 | H200 | 8,061.94 | $0.172277/M at recorded $5/h | Initial Qwen 3.6 Intel H200 screen |
| Qwen 3.6 PalmFuture GPTQ | H200 | 8,489.40 | $0.163603/M at recorded $5/h | Best H200 screen in this table |
| Qwen 3.6 Intel mixed-INT4 | H200 | 8,377.97 | $0.165779/M at recorded $5/h | Strong throughput, not the cost leader |
| Qwen 3.6 Intel mixed-INT4 | RTX PRO 6000 | 5,126.77 | $0.149000/M at $2.75/h normalisation | Qwen 3.6 leader at the time |
| Qwen 3.6 source NVFP4 | RTX PRO 6000 | 6,064.60 | $0.125959/M at $2.75/h normalisation | Final steady-state performance leader |
The H200 and RTX records use different serving conditions and cost bases. They are screening outcomes, not a matched GPU A/B. Calculate cost per completion token with the hourly rate you expect to pay before buying a faster GPU. Include latency targets, replica count, and utilisation when those drive the deployment decision.
3. KV cache and memory capacity
The key-value cache stores context needed to generate the next token. Cache format and available GPU memory therefore determine how much request state the service can retain. In an otherwise identical Intel MTP1/Marlin configuration, FP8 E4M3 key-value cache raised throughput from 4,940.76 to 5,072.34 tokens per second and lowered cost from $0.154610/M to $0.150599/M. Changing its default 16-token pages to 32 tokens reduced throughput to 5,018.22 tokens per second and raised cost to $0.152223/M.
For managed NVFP4, we held the checkpoint and final replay fixture fixed and changed GPU memory available to the runtime.
| GPU-memory utilisation | Completion tok/s | $/M completion tokens | Decision |
|---|---|---|---|
| 0.92 | 5,564.91 | $0.137269 | Control |
| 0.94 | 5,519.31 | $0.138403 | Rejected: worse than 0.92 |
| 0.96 | 5,684.28 | $0.134386 | Adopted |
The 0.96 configuration was 2.10% cheaper than the 0.92 control and 9.81% cheaper than Intel's canonical $0.149000/M result. Moving from 0.92 to 0.94 raised $/M; moving from 0.94 to 0.96 lowered $/M. The final path used FP8 E4M3 cache, an eight-bit float with four exponent bits and three mantissa bits.
4. Admission control and scheduler policy
Admission and scheduling controls set the operating limits:
- Reducing resident capacity from 512 to 480 lowered $/M by 0.48%. The gain missed the adoption threshold, so 512 remained the operating setting.
- At 1,536 offered clients, $/M rose by 0.91% and mean time to first token increased by 3.76 seconds. At 1,024 offered clients, $/M rose by 0.44% and mean time to first token fell by 3.81 seconds. The 1,280-client setting remained the cost choice for this batch service.
- Reducing the model-length ceiling from 2,048 to 1,024 tokens produced 5,110.34 tokens per second and $0.149479/M in the Intel control. It was 0.32% slower and more expensive, and it excluded World inputs that span 1,024 to 2,048 tokens.
- Batch-token limits of 12,288 and 20,480 cost $0.135746/M and $0.135406/M, respectively, versus $0.134386/M at 16,384.
- A 24,576-token setting failed the warm-up gate with a CUDA out-of-memory error before a full score could exist.
- A dense CUDA Graph ladder shaped around observed traffic was 3.42% slower than the standard ladder.
- Disabling prefix caching, chunked prefill, or statistics failed to clear the 0.75% adoption threshold. Requests for alternate asynchronous scheduling produced no material gain, but logs did not confirm that the alternate scheduler activated.
Cache format, memory fraction, resident capacity, batch capacity, prefill policy, and graph capture compete for GPU memory and scheduling time. Longer prompts increase cache pressure. Longer completions change the prefill/decode mix. Latency-sensitive services can prefer a capacity setting that a saturated batch service rejects. Select the cheapest setting that completes the required workload.
5. Native MTP and NTP
Standard next-token prediction (NTP) generates one token per decoding step. Qwen's native multi-token prediction (MTP) path adds a predictor that proposes tokens for the full model to accept or reject. We tested the NTP baseline, MTP with one, two, and three proposals, and a language-model-only MTP control. Accepted proposals must save more target-model work than the predictor adds in compute and memory overhead.
| Matched configuration | Completion tok/s | $/M completion tokens | Outcome |
|---|---|---|---|
| Managed NVFP4 with one proposal | 5,658.41 | $0.135001 | Control |
| Same configuration without the predictor | 5,033.49 | $0.151761 | 11.04% lower throughput |
| Same configuration, one proposal, text-only mode | 5,092.55 | $0.150001 | 10.00% lower throughput |
Removing the MTP predictor (the NTP baseline) reduced matched-control throughput by 11.04%. In the earlier configuration with 0.92 GPU-memory utilisation and a 24,576-token batch limit, one MTP proposal cost $0.151559/M and two proposals cost $0.160839/M. The second proposal raised cost. In an otherwise matched Intel test, three proposals reached 4,534.37 tokens per second: 6.91% slower and 7.43% more expensive than one proposal.
6. DFlash: not viable for World
DFlash is a separate block-diffusion speculative-decoding method. It uses the official FP8 target and an external eight-token draft. It does not use Qwen's native MTP head. We tested it as a separate serving mode on SGLang.
| Attempt | Outcome | What it established |
|---|---|---|
| H200, 1,280-resident target path | No traffic: target attention required SM100. | The target path was not H200-compatible. |
| H200, FA3 fallback at 1,280 resident requests | No traffic: empty startup exit. | The failure had no defensible single cause. |
| H200, minimal 700-resident path | No traffic: platform diagnostics reported OOM, but raw logs did not confirm it. | This is a capacity diagnostic, not a throughput result. |
| H200, published 32-resident capacity shape | 3,583.78 tok/s; $0.387549/M; 4,096 / 4,096 requests completed. | It was valid only after capacity fell to 32 resident requests. |
| RTX PRO 6000, published target path | No traffic: target attention required SM100. | The path was not compatible with this RTX Blackwell GPU. |
| RTX PRO 6000, FA4 fallback | No traffic: startup required BF16 Mamba state. | The failure specified a repair. |
| RTX PRO 6000, FA4 fallback with the repair | No traffic: empty startup exit. | The method produced no RTX performance result. |
The valid H200 run queued 1,280 offered clients behind 32 resident requests. It delivered a real full-load result, but at $0.387549/M it was not cost-competitive for World. No no-draft control used the same SGLang runtime and 32-resident shape, so this result rejects the deployment configuration; it does not isolate DFlash overhead. The high-capacity H200 route and every RTX route stopped at compatibility or startup gates. DFlash did not enter the deployment choice.
Draft acceptance, draft-state memory, target-GPU kernel support, and scheduler capacity can each eliminate a net speculation gain. Compare each separate draft method with a matched no-speculation control.
7. Execution paths
A kernel is the GPU program that performs a model operation. Marlin, FlashInfer, CUTLASS, Triton, TensorRT-LLM, and DeepGEMM provide low-precision execution paths. A runtime can select a path, fall back to another, or reject a layout.
In a controlled official Qwen 3.5 FP8 H200 test, enabling DeepGEMM delivered 7,197.30 completion tokens per second and $0.192974/M. Disabling only DeepGEMM delivered 7,661.29 tokens per second and $0.181286/M: 6.45% more throughput and 6.06% lower cost. The kernel remained compatible; it was slower for this workload.
B12X mixture-of-experts routing
B12X was a separate FlashInfer execution route for the NVFP4 target's mixture-of-experts layers. It selected successfully and completed World traffic, but it was expensive in every early configuration.
| B12X configuration | $/M completion tokens | Outcome |
|---|---|---|
| Target B12X with MTP3 | $0.282431 | Completed, but uneconomic |
| Target B12X with MTP2 | $0.254162 | Completed, but uneconomic |
| Target B12X with MTP2 and Marlin atomic add | $0.258342 | Completed, but more expensive |
| Target B12X with MTP1 | $0.234710 | Best B12X result; still uneconomic |
Later source tests could select B12X but could not carry the full World load. One stopped before API readiness, two could not allocate a 2.58 GiB minimum cache, a reduced-batch warm-up timed out 168 of 1,024 clients, and the first scored pass completed 1,520 of 4,096 requests. B12X did not advance.
Unsloth NVFP4 began at 5,040.22 tokens per second and $0.151559/M, behind Intel. Memory and scheduler changes lifted managed NVFP4 to 5,684.28 tokens per second and $0.134386/M. We ran the source runtime in fresh allocations and averaged two passes at 6,064.60 tokens per second and $0.125959/M with the same checkpoint.
The final runtime used vLLM source commit 226749b, built with CUDA 13 for Blackwell. Startup logs confirmed the selected path:
- FlashInfer CUTLASS for NVFP4 linear operations.
- FlashInfer CUTLASS for NVFP4 mixture-of-experts operations.
- FlashInfer attention.
- FlashInfer CUTLASS for the unquantised auxiliary predictor.
The source runtime used Triton kernels v3.5.1 and a Blackwell adaptation that disabled an unsupported FlashAttention-3 (FA3) extension. The adaptation changes the build and selected attention path. Runtime logs selected FlashInfer attention.
Alternate execution paths either rejected the NVFP4 checkpoint, failed the 1,280-client load, or cost more. An exact-shape mixture-of-experts autotuning test changed the maximum graph-capture size for FlashInfer CUTLASS autotuning. It completed at 5,990.35 tokens per second and $0.127520/M, 1.24% more expensive than the automatic final path. The source winner completed two full fresh-allocation passes.
| Source-runtime pass | Successful requests | Completion tok/s | $/M completion tokens |
|---|---|---|---|
| Pass 1 | 4,096 / 4,096 | 6,035.68 | $0.126562 |
| Pass 2 | 4,096 / 4,096 | 6,093.53 | $0.125359 |
| Mean | 8,192 / 8,192 | 6,064.60 | $0.125959 |
This result was 6.27% cheaper than managed NVFP4 and 15.46% cheaper than Intel's canonical configuration. We selected the automatic backend after reviewing startup logs and reproducing the result in a fresh allocation.
8. Transport and release gates
Delivery mode and client concurrency can change a serving result under offered load. No delivery variant produced a repeatable performance gain, so none entered the final configuration.
Managed NVFP4 completed an endurance run of 16,384 requests without HTTP or streaming errors. Its deterministic translation screen covered 16 source languages and found no blank output, repetition loop, malformed response, or observed systematic omission of named entities or numbers. The source runtime has throughput evidence, not output qualification. It must pass the same output screen before promotion.
Release decisions
| Question | Required evidence |
|---|---|
| Can it load? | Startup and functional response |
| Can it carry intended demand? | High-concurrency warm-up and full request completion |
| Is it cheaper? | Repeated, matched steady-state measurement |
| Is a gain real? | Fresh-allocation reproduction |
| Is it safe to release? | Endurance and representative output checks |
Test protocol and adoption rules
In the matched final RTX fixture, Qwen 3.5 Intel AutoRound cost $0.149374/M and Qwen 3.6 Intel AutoRound cost $0.149000/M. The 0.25% difference missed the 0.75% adoption threshold, so we treat the releases as one serving family for this non-thinking workload.
Each experiment answered a bounded question: whether a checkpoint loaded, whether a kernel supported its layout, whether a serving shape survived warm-up, or whether every client request completed. A failed gate ended that branch before it consumed full-load test time. The final Blackwell comparison records replayed NOSIBLE World translation requests with a 2,048-token context limit, streaming output, disabled thinking, a 256-token completion limit, 1,280 offered clients, and two measured 4,096-request passes.
Every request had to finish. Earlier feasibility, package, and H200 screens chose candidates. They were not matched final comparisons. The final result applies to this replay fixture. Different GPU pricing, prompt lengths, completion lengths, offered concurrency, latency limits, or quality requirements require rerunning the relevant tests.
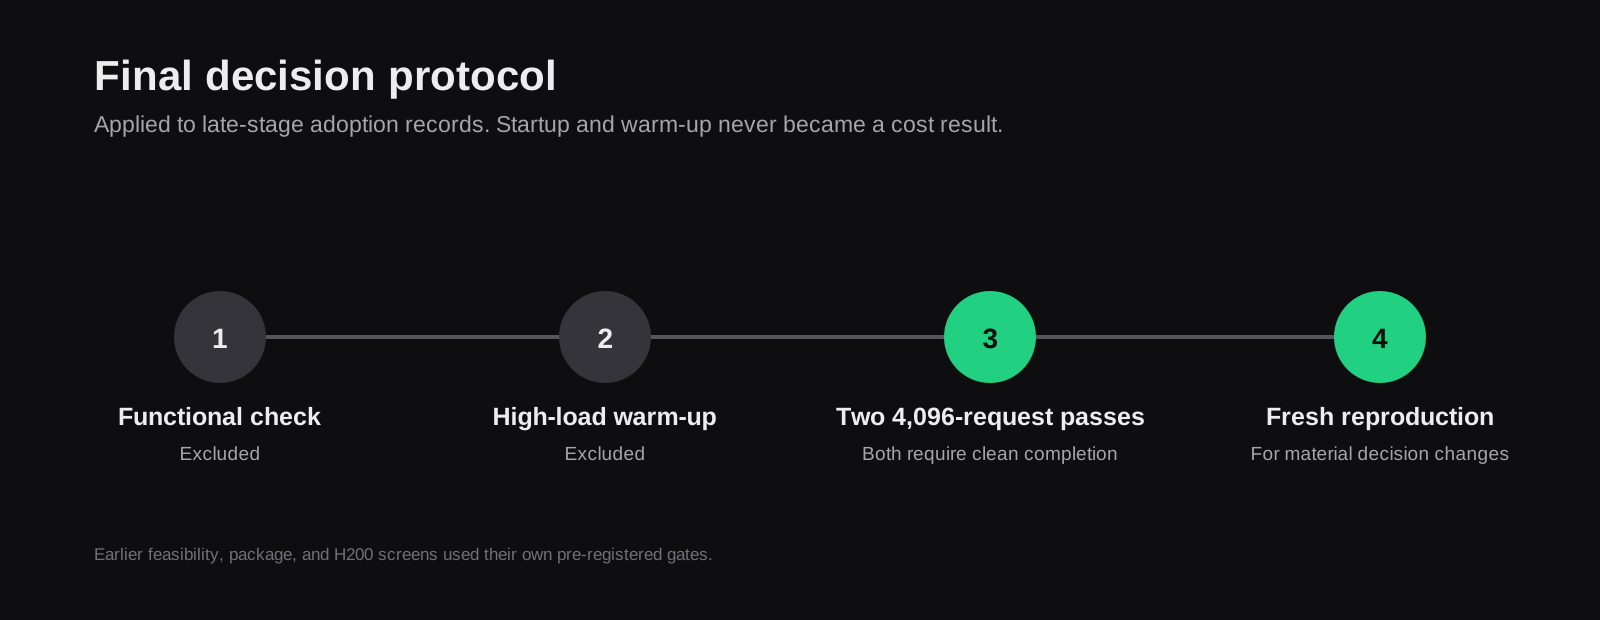
The campaign used five gates:
- A functional request confirmed a valid response.
- A high-concurrency warm-up exposed capacity and stability problems.
- Two full passes established throughput and cost before a late-stage candidate could change the recommendation.
- A fresh allocation reproduced material gains.
- Endurance and output checks qualified a release candidate.
The headline reports normalised steady-state GPU cost:
normalised cost per million completion tokens =
    hourly GPU cost x 1,000,000 / (completion tokens per second x 3,600)
The final RTX comparison uses $2.75 per hour as a campaign normalisation. Experiment 332 used an allocation priced at $2.09 per GPU hour plus $0.021 per disk hour, so $0.125959/M is not a provider-neutral deployment quote. H200 records retain their recorded $5-per-hour rate. The calculation excludes startup, source compilation, model download, and JIT work; short-lived jobs must amortise those costs separately.
We adopted only replicated improvements of at least 0.75%. An apparent gain above 3% required a fresh-allocation reproduction. Smaller measured differences stayed in the record but did not change the configuration.
 Measurement gates for the Qwen serving campaign
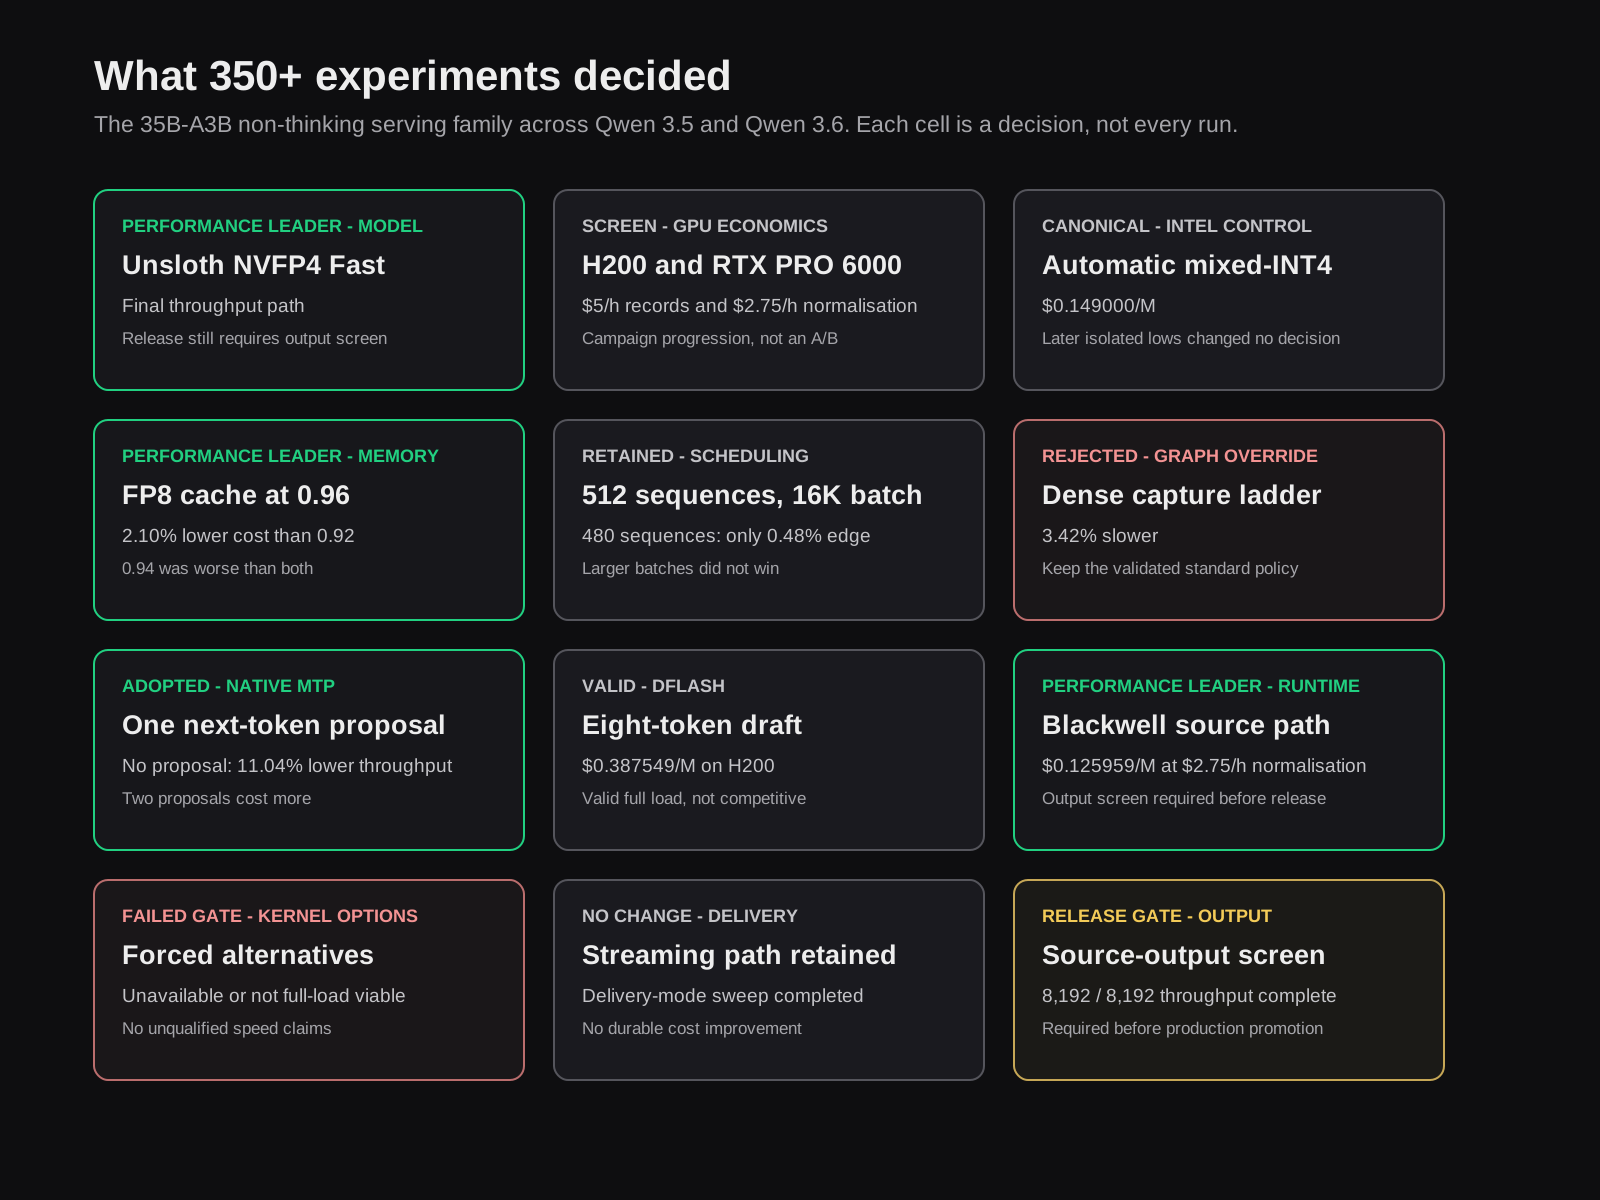
The decision map
 Decision ledger for the major Qwen serving choices
| Family | Work conducted | Final status |
|---|---|---|
| Runtime compatibility | Managed images, newer runtime images, source builds, startup and model-load gates | Only clean services advanced to throughput work |
| Checkpoints and weight formats | Official FP8, GPTQ, AWQ, NVIDIA NVFP4, Unsloth NVFP4, W4A16, and Intel mixed-INT4 packages | NVFP4 source performance path selected; Intel mixed-INT4 retained as the benchmark; official NVIDIA NVFP4 did not advance; source output gate pending |
| GPU and provider economics | H200 and RTX PRO 6000 screening using recorded H200 rates and the RTX campaign normalization | RTX PRO 6000 won the operating-cost decision |
| Quantised execution | Marlin, Humming, FlashInfer CUTLASS, Triton, DeepGEMM, and other candidate paths | Use the selected path confirmed in startup logs; DeepGEMM disabled in the tested H200 path |
| Context state and cache | FP8 key-value cache, 16- and 32-token pages, state capacity, cache format and cache allocation | FP8 E4M3 retained on the final path; 16-token pages retained in the Intel MTP1/Marlin control |
| Context, memory and admission | Model-length ceiling, GPU-memory fraction, resident sequences, offered concurrency, batch-token ceiling, time to first token | 2,048 context, 0.96 memory, 512 resident sequences, 16,384 batch tokens, C1280 cost choice |
| Scheduler and graph policy | Chunked prefill and prefix cache, asynchronous modes, CUDA Graph coverage | Keep the validated standard path; dense graph override rejected |
| Native MTP and NTP | No proposal, one proposal, two proposals, three proposals, and text-only control | MTP1 adopted; MTP2 and MTP3 rejected |
| DFlash speculation | Official FP8 target with an eight-token draft; compatibility and capacity variants | Valid full-load result, but not competitive |
| Request delivery | Streaming and transport variants under offered client load | No adopted improvement |
| Reproducibility | Repeated passes, fresh allocations, backend selection logs and source-build audit | Required for the final source-runtime result |
| Qualification | Functional, warm-up, full-load, endurance and output checks | Source output screen remains the final release gate |
Actions for another serving campaign
- Choose GPUs based on output cost, latency, capacity, and quality requirements.
- Screen checkpoint packages before deep parameter sweeps; a mixed-precision checkpoint can beat a lower-bit format.
- Tune cache format, memory fraction, batch limit, resident capacity, and graph capture together because they use the same GPU memory and scheduling resources.
- Compare native MTP with its NTP control, then test external draft methods as separate serving modes.
- Record the runtime path and build adaptations because kernel selection can change measured throughput and $/M.
For the fixed NOSIBLE World replay fixture, Unsloth NVFP4 Fast on RTX PRO 6000 Blackwell was the steady-state performance leader at 6,064.60 completion tokens per second and $0.125959/M. The source runtime used one native proposal, FP8 E4M3 cache, 0.96 GPU-memory utilisation, 16,384 batch tokens, and 512 resident sequences. The source runtime must pass the retained output screen before release.
World V2 is why we ran this campaign. Re-run the relevant branches when GPU architecture, GPU price, prompt length, completion length, offered concurrency, latency target, or quality requirements change. For a new Blackwell stack, start with the NVIDIA RTX PRO 6000 specifications, the CUDA compatibility guide, and the NVIDIA Developer Forums, then measure the service.
External sources and implementation terrain
- Qwen 3.5 35B-A3B FP8 model card and Qwen 3.6 35B-A3B FP8 model card
- NVIDIA Qwen 3.6 NVFP4 checkpoint, Intel mixed-INT4 AutoRound checkpoint, and Unsloth NVFP4 Fast checkpoint
- NVIDIA Model Optimizer NVFP4 reference, AutoRound, and Marlin
- vLLM, vLLM speculative decoding, vLLM FP8 key-value cache, FlashInfer, CUTLASS, Triton, TensorRT-LLM, and DeepGEMM
- DFlash, NVIDIA H200, NVIDIA RTX PRO 6000 Blackwell, Gemini models, DeepSeek, and the NVIDIA Developer Forums
The Future That Could Have Been: Turning Web Text into Semantic Stock Betas
Two Tricks for Turning Sentence Embeddings into Clean Features